|
Tracking Results
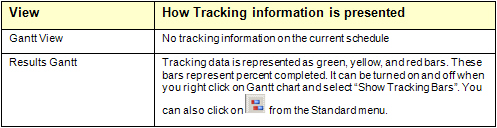
The probabilistic calculations always encapsulate the tracking
information if it has been entered for a task. RiskyProject presents
results of the tracking calculations in several different ways
depending upon the view you are using to examine it.
Entering tracking data
1. Select the task to which you want to enter the tracking data.
2. Open the Task Information
dialog box.
3. Click the Tracking tab. By default, the first
row should contain the actual start time with zero percent done.
4. Click the row below the previous entry.
5. Enter the date or select it from the calendar.
6. Enter the percentage of the task completed by the specified date.
All dates and percents must be consistent. For example, you cannot
have a record with 60% completed before a record with 40%completed.
In addition, you cannot have historical data with the date Jan
5,2004 before the record with Dec 14,2003
7. Type in a comment to record actual details of work completed. You
can now view the Tracking chart.
To view any tracking information, including the percentage completed
for summary tasks and the project, you must calculate the project.
See
also
Tracking Performance
Task Information Tracking
|