|
Frequently Asked Questions
How do I
assign risks to tasks?
How should I use the
risk register?
When
should I correlate risks and how do I do it?
How are risk probabilities, impacts, and scores calculated?
How can I update a project schedule from Microsoft Project and keep
my assigned risks?
Why is my project duration with risk and uncertainties slightly
different in version 3.1 compared to version 2.1?
How do I plan a risk
response?
How can I compare mitigation efforts using different baselines?
How many
iterations are required in a simulation?
When should I use a risk event instead of a statistical
distribution?
What are mutually exclusive alternatives for risks and how are they
calculated in RiskyProject?
What are risk templates and how do they differ from the risk
register?
How do I use the probabilistic cash flow to as part of my product
lifecycle management?
When should I
use probabilistic calendars?
How do I customize risk
outcomes?
I imported schedule from Microsoft Project to RiskyProject. Are any
potential differences?
I cannot open
Microsoft Project MPP’s file
How can I
define opportunities versus threats?
Why is the high result for duration or cost for the current schedule
s different from the high results?
How do I assign risks to tasks?
You can assign risks to task using four methods in RiskyProject.
1. Risk Register: If you are using the Risk Register, you can assign
a risk and mutually exclusive risk alternatives to tasks by
double-click on the risk in the risk register and assigning tasks to
the risk in the Assign to tasks or resources tab.
2. Global Risk Assignment view: Double click on risk ID in Global
risk view and use Assigned to Tasks or Assigned to Resources tab.
You may assign these global risk to multiple tasks or resources at
the same time. After you make assignment of global risk to specific
tasks and resources, global risk assignment will be disabled,
otherwise risk will be applied twice.
3. Local Risk Assignment views for tasks and resources: By default,
this view is not shown in the Risk workflow bar. You can open this
view by clicking the All Views button in the Workflow bar and
selecting Local Risks (Tasks). This method is useful when you make
assignment with the same parameters (chance, outcome, result, and
moment of risk) to multiple tasks or resources.
4. Risk Tabs on Task Information and Resource Information Dialog
boxes: You can create and assign local risks to the task using this
method. This is a preferred method of you want to assign few
different risks to few separate tasks or resources.
How should I use the risk register?
You should use the risk register as the central place to define your
project’s risk break down structure. Once you have added the risks,
from the risk register you can:
• Add risk properties (date created, recorder, owner, etc.)
• Assign risks to tasks and resources
• Sort and filter risks
• View risk status, including results of mitigation efforts.
Risks can be opened and closed, risk or issues, threats and
opportunities.
When should I correlate risks and how
do I do it?
Risk correlations are useful when the two risks are likely to occur
together. For example, the risk “bad weather” is correlated with the
risk “late delivery of materials”. You can create risk correlations
in the Correlations tab of the Risk Information dialog box in the
Global and Local risks views, as well as risk tabs for tasks and
resources.
RiskyProject uses only strong correlation between risks. If Risk 1
has chance of occurrence is 10% and Risk 2 chance of occurrence is
20% and both risks are correlated, Risk 1 will always occur when
Risk 2 occurs, but Risk 2 may occur when Risk 1 does not occur.
How are risk probabilities, impacts,
and scores calculated?
Risk probabilities, impacts, and scores are calculated the following
way:
• RiskyProject tracks impact on each risk on different project
parameters for each iteration of Monte Carlo simulations. It is done
is absolute units. For example, in first iteration Risk A caused
delay 2 days.
• RiskyProject also calculates duration, cost, success rate,
finish time, and work on each iteration.
• RiskyProject calculates the Spearman Rank Order correlation
coefficient between duration impact for each risk and project
duration. This coefficient is presented in Sensitivity view.
• Correlation coefficient is not a risk impact yet. It only
shows how the risk affects the project. If a correlation coefficient
is low, and the risk is not correlated with duration, it means than
some other factors affect duration rather than this risk. To become
an impact, correlation coefficient must be normalized. For example,
you have a schedule, which has only one risk with outcome increase
duration on 2 days. Correlation coefficient will be 100%, because
schedule does not have any other uncertainties. Now change risk
outcome to 100 days. Correlation coefficient again will be 100%.
Risk impact takes into an account absolute value of duration
increase, cost increase, etc. If the duration increased 2 times as
compared with the original project schedule, the normalization
coefficient is 1. Otherwise, the normalization coefficient will be
greater or less than 1. Impact equals correlation coefficient
multiplied on normalization coefficient.
• Risk probability calculated based on chance of risk on for
each assignment. If risk has only one assignment, calculated
probability equals input chance. If the risk as multiple assignments
which as not mutually exclusive alternative, the probability is
calculated by combining risk results of each iteration as shown in
the example:
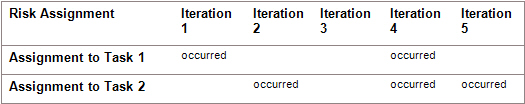
Combined probability will be equal 80%
• Risk score equals probability multiplied on impact.
• For risks affecting All Parameters (combination of duration,
cost, safety, quality, etc.) calculated impact is calculated using
impact for each risk category, multiplied on relative importance of
risks for this category. For schedule related risk categories risk
impact on finish time and success rate will not be used to calculate
risk impact. For schedule related risk categories, the risk impact
on finish time and success rate will not be used to calculate risk
impact. This relative importance can be seen on the Risk Outcomes
(Risk menu).
How can I update a
project schedule from Microsoft Project and keep my assigned risks?
When you import (click on Import from File menu) an updated schedule
from Microsoft Project, RiskyProject gives you the option of
completely overwriting the existing schedule or updating the
existing schedule with new data in Microsoft Project, while keep
global and local risk assignment. This is useful for if you
originally exported the schedule and assigned risks to the project.
RiskyProject keeps unique task Ids from Microsoft Project. However,
if you even rename task in Microsoft Project, your risks would not
be assigned to appropriate tasks, when you import a new schedule to
RiskyProject.
Why is my project duration with risk
and uncertainties slightly different in version 3.1 compared to
version 2.1?
RiskyProject 3 uses different algorithm to calculate project
duration with risks and uncertainties. In RiskyProject 2, duration
is calculated as mean of project durations from each iterations.
Since project start and finish times are calculated similar way,
project start time + project duration may not be exactly equal
project finish time. It can cause some confusion. In RiskyProject 3,
project duration is calculated as the difference between project
start and finish time.
How do I rank schedule related and non-schedule risks together?
RiskyProject calculates the relative impact of both schedule-related
and non-schedule risks in such a manner to provide a valid
comparison of both types of risks in regards to potential impact on
the project. The basis of this comparison is the relative weight
(importance) that you assign to each risk category. You can view the
impact (threat or opportunity) of each risk in the Risk Matrix view
and Risk Register view. In Global risk assignments view and in Risk
Tabs of Task Information Dialog box and Resource Information Dialog
box you will find an impact of the risk on all parameters under
“All” (Calculated impact on all project parameters) column.
How do I plan a risk response?
Risk response planning is done in the Mitigation or Response view on
the Risk workflow. Risk responses are activities that will occur in
a risk occurs. These activities can be modeled in a similar manner
as a risk with an outcome and result. Risk Mitigation and Response
view can be useful, if you have many risks causing the same
response.
You assign the risk response to a risk as a risk outcome “Execute
Response Plan” and the response plan as the result.
For example, you have two risks “Problem with supplier” and “Problem
with the component” that will initiate the same response “Replace
Component”. If you define “Replace Component” and assign it to both
risks using the risk outcome “Execute Response Plan”, the response
plan will be executed only once even if both risks occur together.
How can I compare mitigation efforts
using different baselines?
There are two methods to view the results of your mitigation
planning against the original schedule. To compare the results,
first create a baseline using the results from the original
schedule. Model the planned mitigation efforts in your current
schedule taking into account any additional activities and costs
that the mitigation efforts will entail (these may also introduce
additional risks)
In the risk register, use the Configure Pre and Post Mitigation
button to select the original baseline as the pre-mitigation and the
current schedule as the post-mitigation. The risk register will
display the risk impact and score of each risk for the pre and post
mitigation schedules.
In the Manage Baselines dialog box, you can compare major project
parameters of the two schedules: Duration, Finish Time, Cost, and
Success Rate.
How many iterations are required in a simulation?
The number of iterations required depends upon the risks you have
assigned to the project. Normally, the minimum number of iterations
is 200 and can be adequate on small, non-strategic projects.
However, if you have risks that have a very low chance of occurring,
but have a potential large impact, the results will not account for
this risk unless you run sufficient simulations. For example, your
project has a 0.5% chance of being cancelled due to political
instability. You must run at least 200 iterations, just to ensure
just to ensure that the simulation runs a single occurrence of this
risk. To adequately model these types of risks, we recommend a
minimum of 600 simulations.
When should I use a risk event instead of a statistical
distribution?
RiskyProject supports both methods of risk analysis. Statistical
distribution or uncertainty modeling is recommended in projects
where there is strong and analogous historical data that is
supported by expert opinion.
If this data does not exist, risk event modeling will normally
result in a more accurate assessment of your project risk and
uncertainty. In addition, risk events make it much easier to
identify critical risks through sensitivity analysis as most if not
all uncertainty in a project is caused by risk events. Without risk
event modeling, you will need to do a root cause analysis to
identify which risks are causing the uncertainty in your project.
What are mutually exclusive alternatives for risks and how are they
calculated in RiskyProject?
Mutually exclusive alternatives are used to calculate alternate
outcomes for the same risk event that cannot occur at the same time.
An alternative risk is similar to using a Boolean “OR” statement.
Only one risk alternative can occur at the same time. For example,
if you have a fire risk, the fire could be minor or major each with
different outcomes. They are the same risk, but unlike other risk
events, these alternatives cannot occur at the same time.
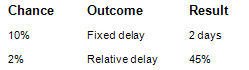
In this example, the risk Fire has two alternatives:
Chance Outcome Result
10% Fixed delay 2 days
2% Relative delay 45%
When the simulations are run, there is a 12% chance that the risk
Fire will occur. 10% of the time the outcome of the minor fire will
be calculated, while 2% of the time the outcome of a major fire is
calculated, but they are never calculated during the same
simulation.
What are risk templates and how do they differ from the risk
register?
A risk template is a flat list of risks that have been assigned a
chance, outcome, result, and distribution. The risk templates can be
imported into risk views where you can quickly assign them as
global, task, or resource risks. In this way, risk templates provide
a quick way of loading risks into your project.
A risk register is a risk management tool that allows you to create,
assign, and track risks in greater detail than any of the other risk
views. The register allows you to add risk properties, assign
ownership, convert risks to issues, and view pre and post mitigation
risk scores.
You may share risk register between different computers in your
organization by saving it to the corporate server. Using
RiskyProject, you may establish simple and easy-to-use corporate
risk management system:
1. Create risk register and save in on the corporate server
2. Load risk register for any new project you created
3. RiskyProject will ensure that different users do not overwrite
corporate copy of risk register through the locking mechanism.
How do I use the probabilistic cash flow to as part of my product
lifecycle management?
Probabilistic cash flow view is used to present original, actual,
and result cash allocation during monthly, bi-monthly, quarterly and
yearly. In RiskyProject, you may apply risks and uncertainties not
only to cost, but also to the income. As a result, probabilistic
cash flow view will present you with negative cash flow (cost) and
positive cash flow (income). It is useful for project lifecycle
management, where you are trying to determine both cost associated
with product development and income associated with sales of the
product.
When should I use probabilistic calendars?
Probabilistic calendars are useful for modeling uncertain scheduling
conditions such as weather. If you know from experience that during
the project there is a 30% chance that you will be operating under
poor weather conditions that will restrict working time, you can
create a calendar that reflects this. Using the probabilistic
calendars, you can then run this calendar 30% of the time to
realistically model weather risks.
How do I customize risk outcomes?
You can add or customize non-schedule risk categories and outcomes
(cost and schedule outcomes are hard coded and cannot be edited).
RiskyProject provides several default risk categories and outcomes
(Legal, Safety, Quality, etc.). You may use Risk Outcomes dialog
from Risk menu to add or modify non-schedule risk categories and
outcomes. You may also enable or disable certain outcomes, so they
are not shown in drop down list when you do risk assignments.
We recommend that you modify the supplied risk outcomes so that they
can be used across your organization. This outcomes are saved in the
system registry and can be used for all projects.
I imported schedule from Microsoft Project to RiskyProject. Are any
potential differences?
In most cases, if you import your project schedule from Project, the
projects in both applications will be identical. However, there are
specific cases that may cause slight differences:
1. RiskyProject currently does not support split tasks. However,
RiskyProject will import work calculated using split tasks.
RiskyProject does not have task usage or resource usage views.
2. RiskyProject calculates task duration differently than Microsoft
Project in cases where resources that have different calendars are
attached to the same task. However, even in these cases, start and
finish times of the tasks will be identical.
3. RiskyProject does not support overtime rates.
4. RiskyProject does not import resource groups. Each resource is
imported individually.
5. RiskyProject does not support the earned value method “Percent
work completed”. Instead, it uses “Percent completed”.
6. RiskyProject does not support certain constraints supported by
Microsoft Project, for example “Finish No Early Than”. The
constraints are not supported cannot be applied to probabilistic
results.
7. RiskyProject imports linked projects as a single task. No details
of the linked projects subtasks are available.
I cannot open Microsoft Project MPP’s file
MPP is a proprietary file format by Microsoft. RiskyProject uses
third-party component to read data from MPP file. RiskyProject can
open almost all project schedules created by Microsoft Project. If
you experience any difficulties reading data from a MPP file, please
export the data as an XML file and open it in RiskyProject.
How can I define opportunities versus threats?
When you create a risk assignment, define a negative outcome result
that translates to an opportunity. For example, fixed delay –2 days
indicates that if the event occurs, the task will require 2 less
days to complete and is an opportunity.
How can I import low, base, and high duration from Microsoft
Project?
Use the following fields in Microsoft Project to represent Low,
Base, and High durations:
Please remember that Duration1 < Duration2 < Duration3
Why is the high result for duration or cost for the current schedule
s different from the high results?
Low and high estimates for inputs, which you define for each task,
are different from low and high results because their actual
meanings are different.
• You define the definition for low and high estimates
for duration, cost, income input in the Distributions tab of Task
Information dialog box. This can be interpreted differently
depending upon what distributions you select. By default, low
distribution inputs are P10 and high is P90.
• You define the definition of low and high results for
duration, cost, and income in the Calculation tab of the Options
dialog box as a percentile of statistical distribution obtained as a
result of your analysis. By default, low distribution results are is
P10 and high is P90.
|