|
Quantitative Risk Analysis with Microsoft Project
PERT Analysis in Microsoft Project
Microsoft Project implements one the Quantitative Risk Analysis technique PERT (Program Evaluation and Review Technique). The PERT model was developed in 1950s to address uncertainty in the estimation of project parameters. According to classic PERT, expected task duration is calculated as the weighted average of the most optimistic, the most pessimistic, and the most likely time estimates. The expected duration of any path on the precedence network can be found by summing up the expected durations.
Using PERT in Microsoft Project is very easy using the PERT toolbar. To enable the PERT toolbar on the View menu, from the Toolbars menu, choose PERT Analysis.
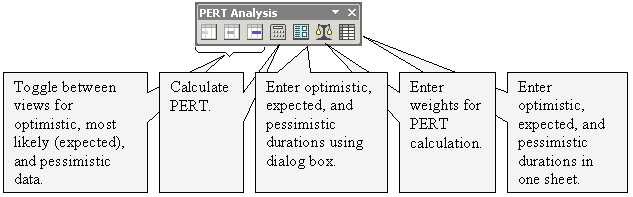
Microsoft Project has four views that help you to enter data for PERT analysis: separate views for optimistic, expected, and pessimistic duration, as well as a PERT entry sheet. The most powerful view is the last one as it allows the user to enter and see all durations together. After you enter project data, press the Calculate PERT button on the toolbar. Calculations are performed based on optimistic, expected, and pessimistic durations. You will see results of the calculation in the Gantt Chart view.
The classic PERT methodology has a number of limitations. The main problem is associated with accurately estimating the optimistic, most likely, and pessimistic durations of the task. Another problem with classic PERT is that it gives accurate results only if there is a single dominant path through a precedence network. If there are a number of parallel paths through the network it gives an overly optimistic estimation. We recommend using the classical PERT model for quantitative risk analysis if you have accurate estimations for optimistic, most like and pessimistic durations based on reliable historical data and if your project has a single dominant path through the network.
|