How to disable low/high traingles on the Gantt chart
Moderator: Intaver Support
How to disable low/high traingles on the Gantt chart
How can I disable triangles depicting low and high estimates of task start and finish times in the Gantt chart within Result Gant View?
Project risk management, decision and risk analysis
-
Intaver Support
- Posts: 1024
- Joined: Wed Nov 09, 2005 9:55 am
Re: How to disable low/high traingles on the Gantt chart
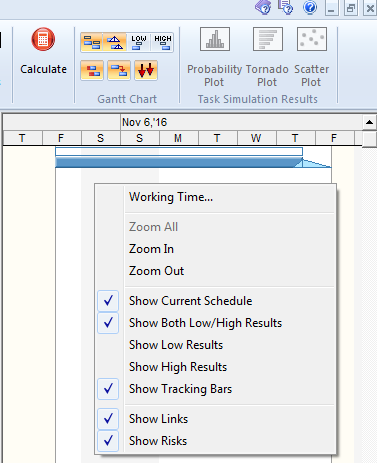
The blue "triangles" are used to display low and high start and finish times for tasks. They are presented within Result Gantt view. Sometimes projects have a lot of uncertainties. In this case the chart can be very crowded, because these "triangles" can be very long. It is possible to disable these "triangles". To do it just right click on the Gantt chart. The drop down menu will come up. Then click on "Show Both Low/High Results". But default these "triangles" are enabled.
Intaver Support Team
Intaver Institute Inc.
Home of Project Risk Management and Project Risk Analysis software RiskyProject
www.intaver.com
Intaver Institute Inc.
Home of Project Risk Management and Project Risk Analysis software RiskyProject
www.intaver.com