View cost distribution for specific time intervals.
Moderator: Intaver Support
View cost distribution for specific time intervals.
Is it possible to see the Monte Carlo charts for cost over a specific interval rather than an activity?
Business Development Manager
-
Intaver Support
- Posts: 1024
- Joined: Wed Nov 09, 2005 9:55 am
Re: View cost distribution for specific time intervals.
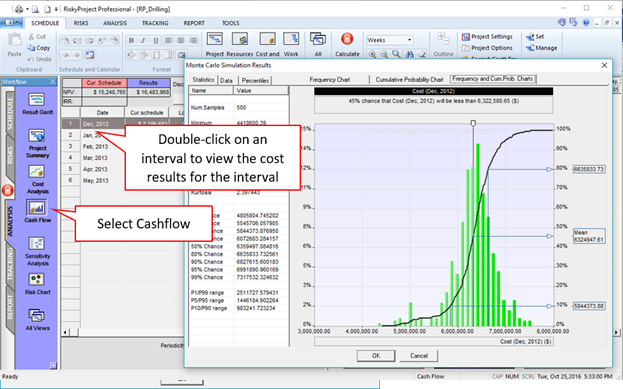
Yes, this information is available in the Cashflow view with provides forecasts about expected revenues (cost and income) over the course of a project.
To view the cost results for a specific interval:
1. On the ribbon, click the Analysis tab >, Cashflow view.
2. Select the time interval from the Periodicity drop-down list. The intervals can be monthly, bi-monthly, quarterly, and yearly.
3. Double-click on the interval or right-click and select Results for selected interval. The Monte Carlo Simulation Results charts open.
Intaver Support Team
Intaver Institute Inc.
Home of Project Risk Management and Project Risk Analysis software RiskyProject
www.intaver.com
Intaver Institute Inc.
Home of Project Risk Management and Project Risk Analysis software RiskyProject
www.intaver.com