Risk Chart for Portfolio Risk Analysis
Moderator: Intaver Support
Risk Chart for Portfolio Risk Analysis
Can you explain how the Enterprise Risked Project Chart works for RiskyProject Enterprise?
-
Intaver Support
- Posts: 1024
- Joined: Wed Nov 09, 2005 9:55 am
Re: Risk Chart for Portfolio Risk Analysis
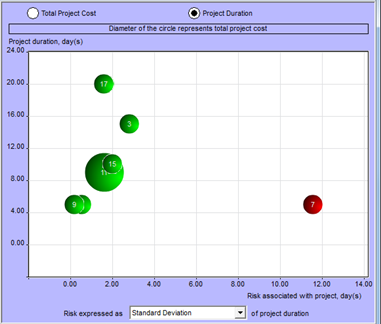
The Risked Projects chart shows the level or relative schedule and cost risk for each project in the Portfolio. It differs from other schedule and cost risk analysis that we can derive from Monte Carlo simulation in that it provides insight into how “risky” projects as a function of the project budget and schedule. For example: Project A with a budget of $ 1M has $100 K of risk, Project B with a budget of $ 2 M also has $100 K of risk. Both have the same actual amount of cost at risk, however Project A has twice as much of relative risk.
From the Risk Projects chart we cannot tell why one project has more relative risk than others, but it provides a additional information that supports the decision making process. It may be an expected result, but could indicate that further investigation and management decisions are required.
From the Risk Projects chart we cannot tell why one project has more relative risk than others, but it provides a additional information that supports the decision making process. It may be an expected result, but could indicate that further investigation and management decisions are required.
Intaver Support Team
Intaver Institute Inc.
Home of Project Risk Management and Project Risk Analysis software RiskyProject
www.intaver.com
Intaver Institute Inc.
Home of Project Risk Management and Project Risk Analysis software RiskyProject
www.intaver.com