Spikes appearing in histograms
Moderator: Intaver Support
Spikes appearing in histograms
Need your insight into “correlation”. I have saw your video tutorial and it is evident that similar risks or different activities or separate risks to single activities can be correlated. What if only single individual risk is affecting the each activity? Results are showing spikes. Any solution?
-
Intaver Support
- Posts: 1067
- Joined: Wed Nov 09, 2005 9:55 am
Re: Spikes appearing in histograms
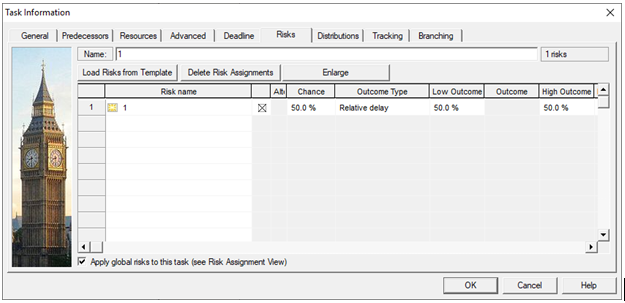
In the example you are talking about, you will see spikes in the results. It is a common and expected results when analyzing using risk events. Let’s take a look at a very simple example of a 5 day activity.
Now, we add 1 risk assignment: 50% chance, 50% relative delay.
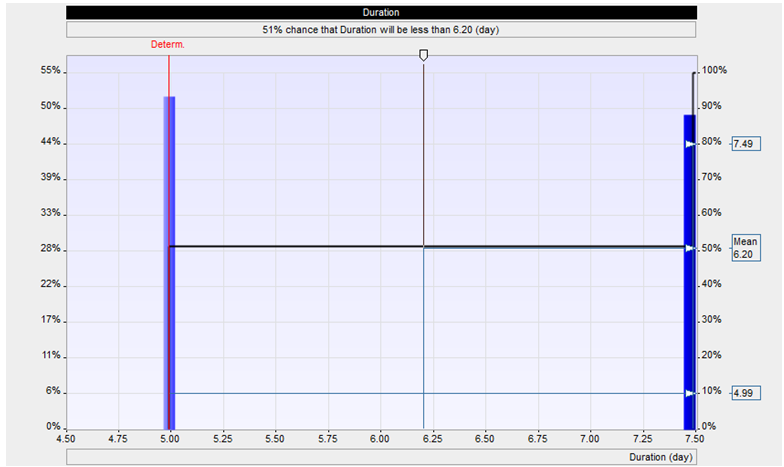
In this the original task is the bar on the left and the risk assignment generates the bar on the right.
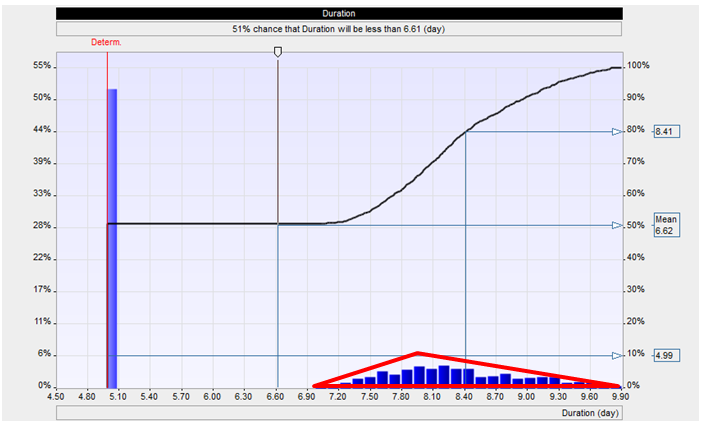
Now if we modify the risk assignment to include an outcome with a triangular distribution with 2,3, and 5 days outcome with a triangular distribution, we get the following output. We can see the risk is appearing as a small triangular distribution to the right of the deterministic bar.
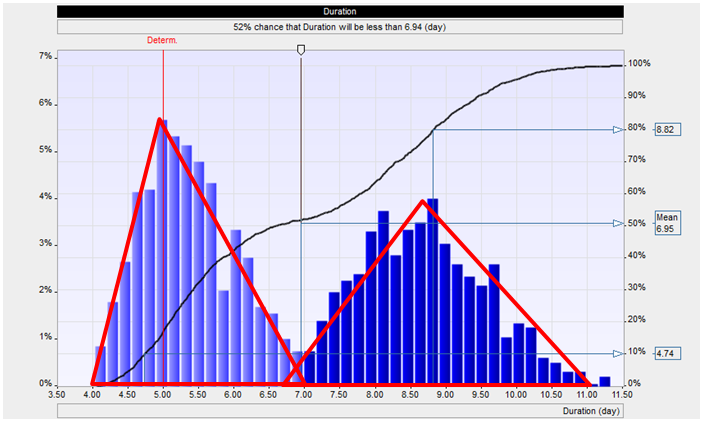
When we add uncertainty to the activity (low of 4 and high of 7, triangular distribution), we get the following output.
Now if we modify the risk assignment to include an outcome with a triangular distribution with 2,3, and 5 days outcome with a triangular distribution, we get the following output. We can see the risk is appearing as a small triangular distribution to the right of the deterministic bar.
When we add uncertainty or aleatory risk to the activity (low of 4 and high of 7, triangular distribution), we get the following output.
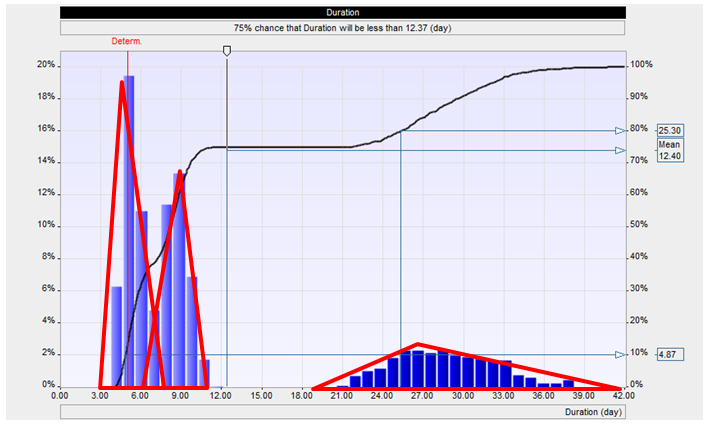
We now have what is called a bi-modal histogram that has two spikes caused by 2 uncorrelated sources of risk impacting the results.
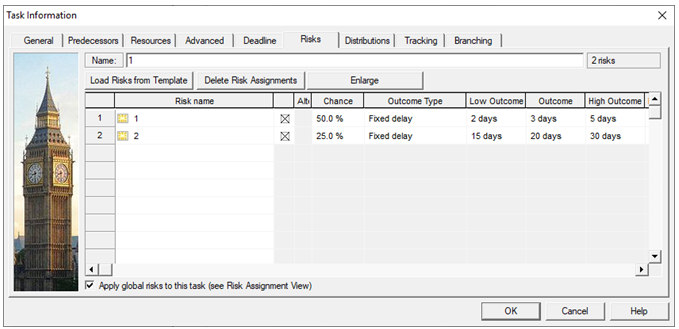
To further develop this, we can add another risk assignment that is not correlated with the first risk assignment.
Now, we add 1 risk assignment: 50% chance, 50% relative delay.
In this the original task is the bar on the left and the risk assignment generates the bar on the right.
Now if we modify the risk assignment to include an outcome with a triangular distribution with 2,3, and 5 days outcome with a triangular distribution, we get the following output. We can see the risk is appearing as a small triangular distribution to the right of the deterministic bar.
When we add uncertainty to the activity (low of 4 and high of 7, triangular distribution), we get the following output.
Now if we modify the risk assignment to include an outcome with a triangular distribution with 2,3, and 5 days outcome with a triangular distribution, we get the following output. We can see the risk is appearing as a small triangular distribution to the right of the deterministic bar.
When we add uncertainty or aleatory risk to the activity (low of 4 and high of 7, triangular distribution), we get the following output.
We now have what is called a bi-modal histogram that has two spikes caused by 2 uncorrelated sources of risk impacting the results.
To further develop this, we can add another risk assignment that is not correlated with the first risk assignment.
Intaver Support Team
Intaver Institute Inc.
Home of Project Risk Management and Project Risk Analysis software RiskyProject
www.intaver.com
Intaver Institute Inc.
Home of Project Risk Management and Project Risk Analysis software RiskyProject
www.intaver.com