Simulation Results for Milestones
Moderator: Intaver Support
-
BusinessDecisions
- Posts: 12
- Joined: Tue Apr 03, 2007 11:25 am
- Location: USA
Simulation Results for Milestones
How can I see statistical distribution of finish time for milestone?
Decision Analysis, Risk Management, Construction Risk, Project Risk Management
-
Intaver Support
- Posts: 1065
- Joined: Wed Nov 09, 2005 9:55 am
Re: Simulation Results for Milestones
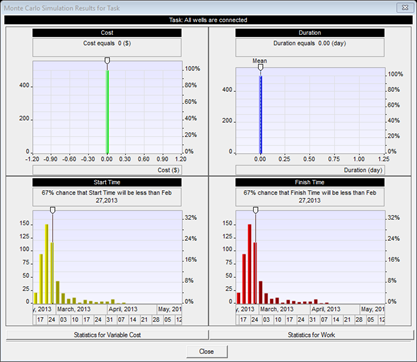
While Milestones do not have a duration, their start and finish times can vary depending upon how the predecessors perform. You can view these results for Milestones using Start Time and Finish Time.
To view the results for a milestone, in the Result Gantt View, select the milestone. On the ribbon, click Analysis > Tasks Simulation Results > Probability Plot. All of the probability charts appear in the Monte Carlo Simulation Results for Task dialog. Double-click on the Finish Time chart to view a detailed version of the chart including histograms and cumulative probability plots.
To view the results for a milestone, in the Result Gantt View, select the milestone. On the ribbon, click Analysis > Tasks Simulation Results > Probability Plot. All of the probability charts appear in the Monte Carlo Simulation Results for Task dialog. Double-click on the Finish Time chart to view a detailed version of the chart including histograms and cumulative probability plots.
Intaver Support Team
Intaver Institute Inc.
Home of Project Risk Management and Project Risk Analysis software RiskyProject
www.intaver.com
Intaver Institute Inc.
Home of Project Risk Management and Project Risk Analysis software RiskyProject
www.intaver.com