Width of the bar on the frequency chart
Moderator: Intaver Support
Width of the bar on the frequency chart
Is width of the bar on the frequency chart for project duration associated with any particular time interval?
Ken the PM
-
Intaver Support
- Posts: 1024
- Joined: Wed Nov 09, 2005 9:55 am
Re: Width of the bar on the frequency chart
Width of the bar is defined by number of pixels and not associated with particular time interval. The same true for cost, start and finish time, work and other frequency charts. The bar width is defined in "Chart Options" dialog. To access chart options dialog right click on the chart and select "Options".
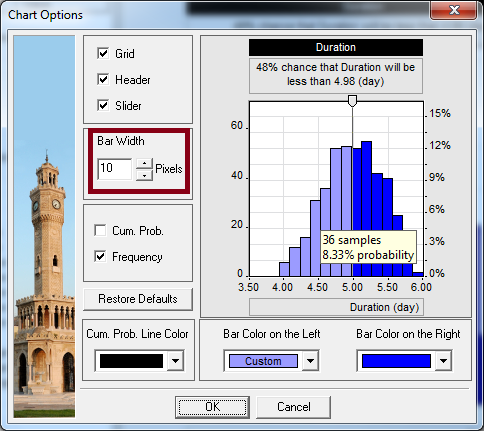
Maximum bar width is 30 pixels, minimum is 6 pixels. The issue is chart options are saved for all tasks and all project in the system registry or in the database of RiskyProject enterprise. Duration of the projects and tasks could be very different. If you define width of the bar in actual units (days, months, etc.) the histograms will look very different for different tasks and projects.
Maximum bar width is 30 pixels, minimum is 6 pixels. The issue is chart options are saved for all tasks and all project in the system registry or in the database of RiskyProject enterprise. Duration of the projects and tasks could be very different. If you define width of the bar in actual units (days, months, etc.) the histograms will look very different for different tasks and projects.
Intaver Support Team
Intaver Institute Inc.
Home of Project Risk Management and Project Risk Analysis software RiskyProject
www.intaver.com
Intaver Institute Inc.
Home of Project Risk Management and Project Risk Analysis software RiskyProject
www.intaver.com