New Features in RiskyProject 2.0
RiskyProject Professional:
Advanced Project
Risk Analysis
RiskyProject Lite:
Introduction to Project Risk Analysis
Here are some of RiskyProject clients:
-
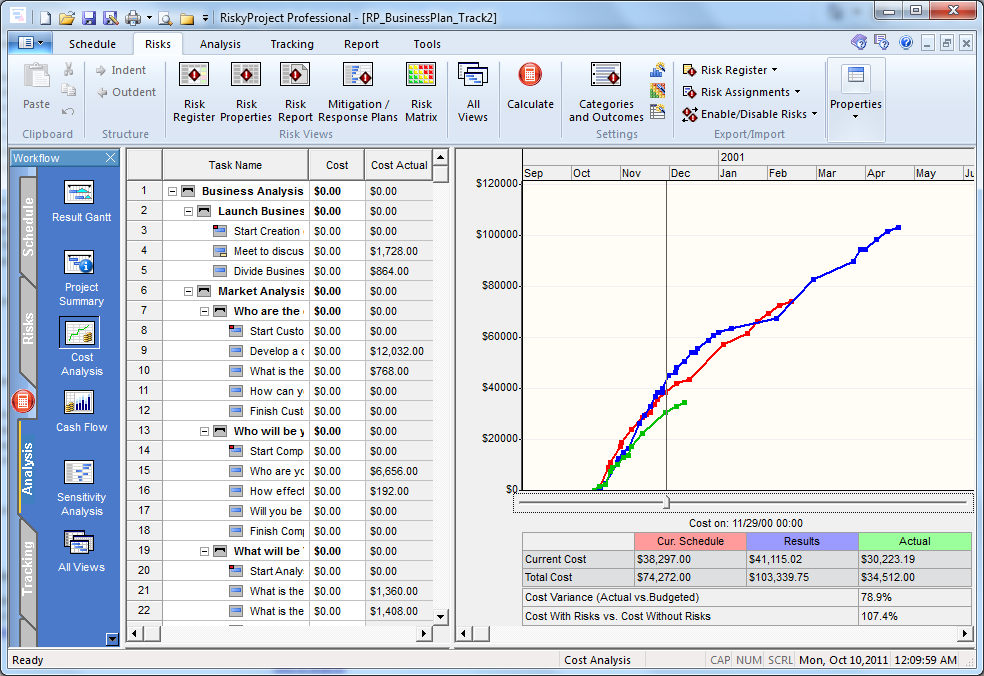
Earned value analysis based on project schedule with risk and uncertainties. New RiskyProject has probabilistic cashflow diagrams
-
Improved project tracking: interactive tracking chart view
-
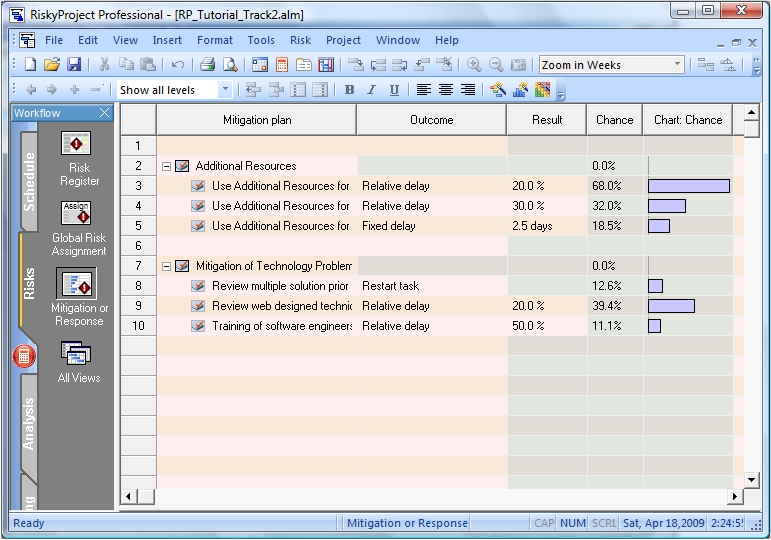
Managing mitigation plans: mitigation plans can be defined using separate view. Mitigation plans can be executed using risk "execute mitigation plan"
-
Risk analysis for product lifecycle management: in addition to cost analysis RiskyProject includes income and revenue analysis with risks and uncertainties
-
Statistical distribution fitting: If you have an empirical data you can use it to generate a statistical distribution for cost, income, duration, and start time
-
Optimistic and pessimistic project schedules based on results of risk analysis can be presented within a Gantt chart.
-
Improved reporting: RiskyProject can generate and print report from most views. New reporting view is added for the results of cost/revenue analysis.
-
New risk templates.
-
Improved user interface: new workflow bar, improved toolbars, formatting Gantt chart bars, you can drag bar of Gantt chart to define task start and finish time. Textual information can be entered using different languages and alphabets (e.g. Cyrillic).