Visualizing Multiple Baselines
Moderator: Intaver Support
Visualizing Multiple Baselines
I cannot visualize multiple baselines on cumulative probability plot. What should I do to see multiple S-Curves?
Jason
-
Intaver Support
- Posts: 1027
- Joined: Wed Nov 09, 2005 9:55 am
Re: Visualizing Multiple Baselines
The issue is that you can create baselines with and without the results of the analysis. If the results of the simulation are not saved with the baseline, the baseline will not appear as a cumulative probability plot. When you create a baseline, the procedure must be followed exactly to save the results of the analysis with the base.
To save the results of the simulation with a baseline.
1. After adding risks and uncertainties, run a simulation.
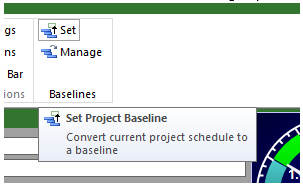
2. On the Schedule tab, in the Baselines group, click Set.

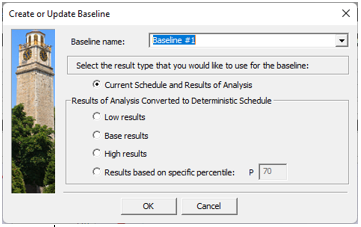
3. In the Create or Update Baseline dialog box, select a baseline or enter name for a new baseline and select the Current Schedule and Results of Analysis option.

4. Click OK.
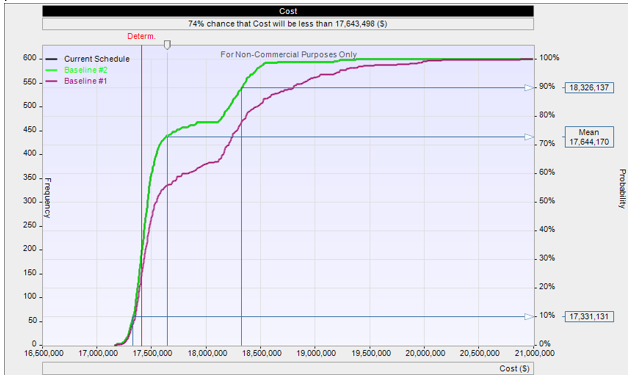
5. Open the Project Summary view. The multiple baselines are visualized as cumulative probability plots.

To save the results of the simulation with a baseline.
1. After adding risks and uncertainties, run a simulation.
2. On the Schedule tab, in the Baselines group, click Set.

3. In the Create or Update Baseline dialog box, select a baseline or enter name for a new baseline and select the Current Schedule and Results of Analysis option.

4. Click OK.
5. Open the Project Summary view. The multiple baselines are visualized as cumulative probability plots.

Intaver Support Team
Intaver Institute Inc.
Home of Project Risk Management and Project Risk Analysis software RiskyProject
www.intaver.com
Intaver Institute Inc.
Home of Project Risk Management and Project Risk Analysis software RiskyProject
www.intaver.com