Interface to Simulation Results
Project Risk Management Software RiskyProject
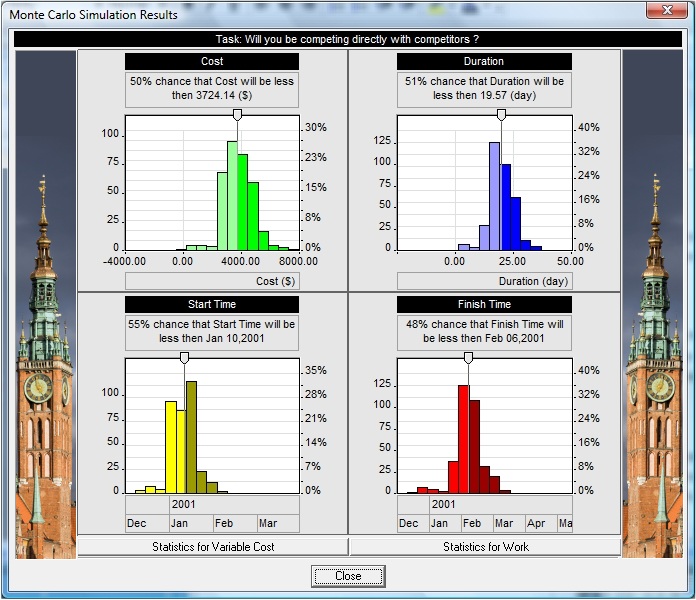
Just double-click on each bar within the Gantt chart to view histograms for duration, start and finish times, and cost, associated with the particular task.
<< Back to RiskyProject Professional < Back Next >