Cash Flow Uncertainties
Moderator: Intaver Support
Cash Flow Uncertainties
How can I view statistical distribution of cost for specific period of time? Can I use cash flow chart for it?
G.K.Jun, program manager, Harrisonburg, VA, USA
-
Intaver Support
- Posts: 1050
- Joined: Wed Nov 09, 2005 9:55 am
Re: Cash Flow Uncertainties
If you want to characterise cost as including both cost and income, then you can use the Cash flow analysis to view cost for specific periods.
To do this, run a simulation and then open the Cash flow chart. On the left you will see the cash flow periods and the right is the cash flow chart.
You can modify the periodicity using the drop down menu on the bottom of the view. Periods can be monthly, bi monthly, quarterly, and yearly.
Select a period from the table on the left and right-click on the number (1,2,3 ….). On the shortcut menu, click Results for selected Interval.
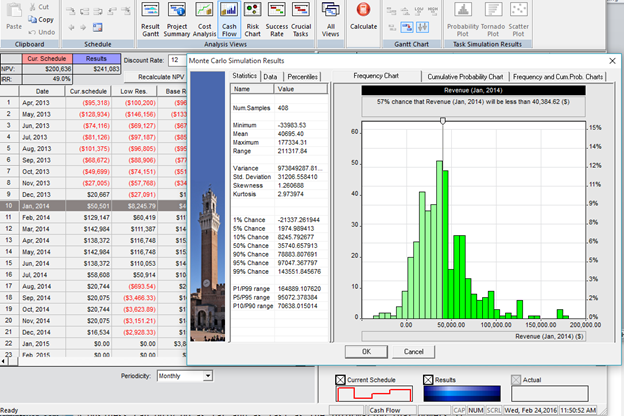
The Results chart appears. You can choose a histogram, cumulative probability or both. As with all charts, these can be copied or saved.
To do this, run a simulation and then open the Cash flow chart. On the left you will see the cash flow periods and the right is the cash flow chart.
You can modify the periodicity using the drop down menu on the bottom of the view. Periods can be monthly, bi monthly, quarterly, and yearly.
Select a period from the table on the left and right-click on the number (1,2,3 ….). On the shortcut menu, click Results for selected Interval.
The Results chart appears. You can choose a histogram, cumulative probability or both. As with all charts, these can be copied or saved.
Intaver Support Team
Intaver Institute Inc.
Home of Project Risk Management and Project Risk Analysis software RiskyProject
www.intaver.com
Intaver Institute Inc.
Home of Project Risk Management and Project Risk Analysis software RiskyProject
www.intaver.com