Cumulative Probability Plot
Moderator: Intaver Support
Cumulative Probability Plot
Can the software do a probability analysis for varying probabilities (i.e. P20, P50, P80 etc on the same program).
-
Intaver Support
- Posts: 1050
- Joined: Wed Nov 09, 2005 9:55 am
Re: Cumulative Probability for present target dates and progress
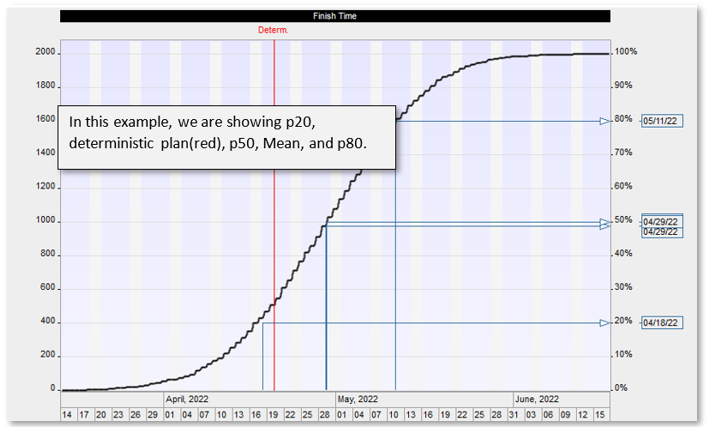
One of the main outputs of a Monte Carlo simulation are Cumulative Probability Plots where are S curves that plot percentiles on the right y axis. In the example below we can see how the varying percentiles for finish time can be presented using cumulative probability plots.
Intaver Support Team
Intaver Institute Inc.
Home of Project Risk Management and Project Risk Analysis software RiskyProject
www.intaver.com
Intaver Institute Inc.
Home of Project Risk Management and Project Risk Analysis software RiskyProject
www.intaver.com