Reporting on Sensitivity Analysis
Moderator: Intaver Support
-
BusinessDecisions
- Posts: 12
- Joined: Tue Apr 03, 2007 11:25 am
- Location: USA
Reporting on Sensitivity Analysis
How can I include tornado chart to report?
Decision Analysis, Risk Management, Construction Risk, Project Risk Management
-
Intaver Support
- Posts: 1024
- Joined: Wed Nov 09, 2005 9:55 am
Re: Reporting on Sensitivity Analysis
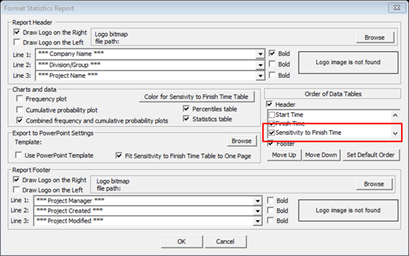
There are several methods. The Statistics Report includes the option to include the Sensitivity to Finish Time tornado chart as part of the report.
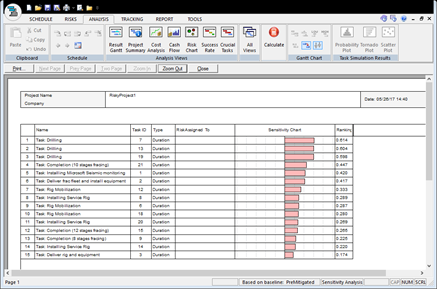
Alternatively, from the Sensitivity View, you can generate an ad hoc report that includes Tornado charts for various project parameters and conditions and risks. To do this just select the Project parameter (e.g Cost, Finish Time, ..) and Task Parameter (Risk, Finish Time, etc…). This will generate a tornado chart showing how sensitive the project is to the particular risk or task parameter.
From the File menu> click Print > Print Preview to preview the report.
It is also possible to use screen captures to add Tornado charts to reports.
Intaver Support Team
Intaver Institute Inc.
Home of Project Risk Management and Project Risk Analysis software RiskyProject
www.intaver.com
Intaver Institute Inc.
Home of Project Risk Management and Project Risk Analysis software RiskyProject
www.intaver.com