Page 1 of 1
Mitigation Waterfall Chart
Posted: Sat Jan 07, 2023 2:52 pm
by Jason
What is the relationships between the Mitigation Assignment, and the Mitigation Waterfall Chart?
Re: Mitigation Waterfall Chart
Posted: Sat Jan 07, 2023 3:22 pm
by Intaver Support
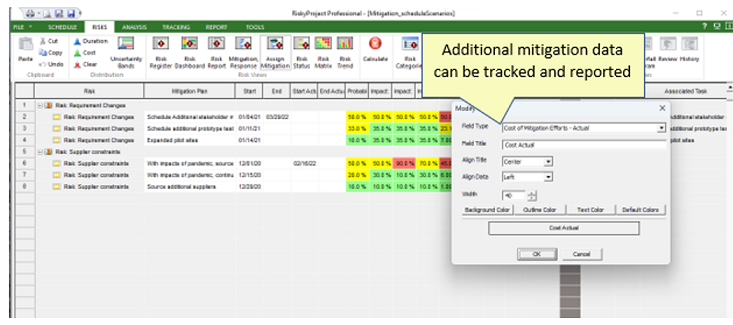
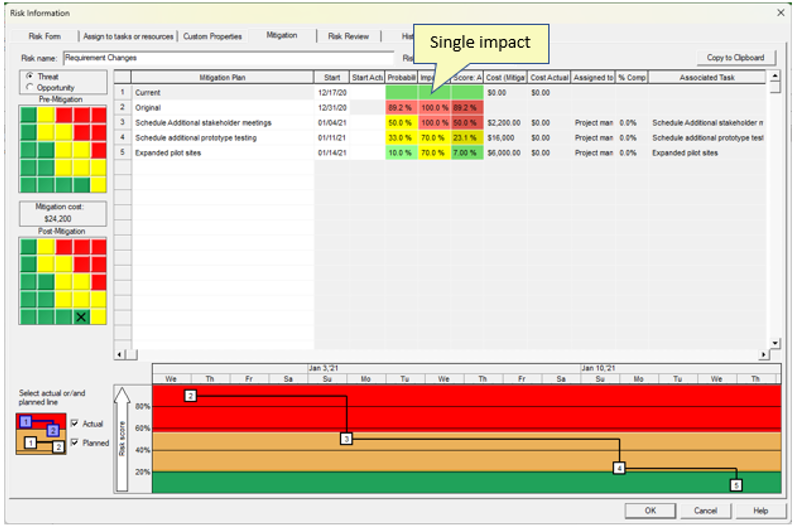
With the release of version 7.2, we have added significant new mitigation planning capabilities of which required the addition of an additional mitigation view as the existing views were designed to support the new capabilities. One of the main changes is the ability to track planned and actuals impacts for all risk categories. In the Waterfall Chart as shown below, only the combined impact of all risk categories can be added.
Mitigation Assignment View helps define and edit mitigation plan assignment to different risks in one view. It shows how risk probability and impact will reduce over time due to mitigation efforts. Mitigation plan assignment now includes information of risk probabilities and impacts for individual categories, such as schedule, cost, technology, etc. In Mitigation Plan Assignment View you can view and modify dates, description, and probabilities and impacts associated with different mitigation steps for all risks.