Calculated Risk Probability
Moderator: Intaver Support
Calculated Risk Probability
Why does the calculated risk probability not match the input risk chance?
-
Intaver Support
- Posts: 995
- Joined: Wed Nov 09, 2005 9:55 am
Re: Calculated Risk Probability
Risk probability is not simply a input value (e.g 50%). At each iteration, the risk has the input chance that it will occur. It is very similar to flipping a coin. If on your first turn it is heads, what is the probability that on the 2nd turn it will be tails? It is 50% for every additional turn. So, at some point it may be that you have 60% heads 40% tails, but with enough flips the overall probability will move towards 50%.
For our purposes in RiskyProject. during each iteration the risk has a chance of occurring Yes or No regardless of the input chance though it does make it more or less likely. E.g. if we run 1 iteration, the calculated probability will either by 100 or 0. If we run 2, it could be 100, 50, or 0... However, because at each iteration it has the set chance that it will occur. the more iterations run the more likely the calculated probability will match the input chance.
For risk scoring, this can be found in our FAQs
How are risk probabilities, impacts, and scores calculated for quantitative analysis?
Risk probabilities, impacts, and scores are calculated the following way:
1. RiskyProject tracks the impact of each risk on each project parameter at each iteration of the Monte Carlo simulation. It is performed using absolute units. For example, in the first iteration Risk A caused a delay of 2 days.
2. RiskyProject also calculates duration, cost, success rate, finish time, and work on each iteration.
3. RiskyProject calculates the Spearman RankOrder correlation coefficient between duration impact for each risk and project duration. This coefficient is presented in the Sensitivity view.
4. Correlation coefficients are not yet a risk impact. They only show how the risk affects the project. If a correlation coefficient is low, and the risk is not correlated with duration, it means than some other factors affect duration other than this risk. To become an impact, the correlation coefficient must be normalized. For example, you have a schedule, which has only one risk with an outcome of an increase in duration of 2 days. The correlation coefficient will be 100% because the schedule does not have any other uncertainties. Now change the risk outcome to 100 days. The correlation coefficient again will be 100%. Risk impact takes into account absolute value of duration increase, cost increase, etc. If the duration increases 2 times when compared with the original project schedule, the normalization coefficient is 1. Otherwise, the normalization coefficient will be greater or less than 1. Impact equals correlation coefficient multiplied with the normalization coefficient.
5. Risk probability is calculated based on the chance of risk for each assignment. If a risk has only one assignment, calculated probability equals input chance. If the risk has multiple assignments which are not mutually exclusive alternatives, the probability is calculated by combining risk results of each iteration as shown in the example:
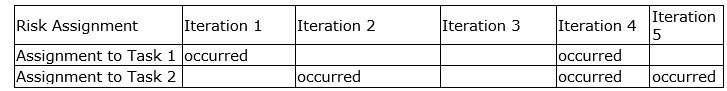
Combined probability will equal 80%
6. Risk score equals probability multiplied by impact.
7. For risks affecting All Parameters (combination of duration, cost, safety, quality, etc.) calculated impact is calculated using impact for each risk category, multiplied on relative importance of risks for this category. For schedule related risk categories risk impact on finish time and success rate will not be used to calculate risk impact. For schedule related risk categories, the risk impact on finish time and success rate will not be used to calculate risk impact. This relative importance can be seen on the Categories and Outcomes dialog (Risk tab).
For our purposes in RiskyProject. during each iteration the risk has a chance of occurring Yes or No regardless of the input chance though it does make it more or less likely. E.g. if we run 1 iteration, the calculated probability will either by 100 or 0. If we run 2, it could be 100, 50, or 0... However, because at each iteration it has the set chance that it will occur. the more iterations run the more likely the calculated probability will match the input chance.
For risk scoring, this can be found in our FAQs
How are risk probabilities, impacts, and scores calculated for quantitative analysis?
Risk probabilities, impacts, and scores are calculated the following way:
1. RiskyProject tracks the impact of each risk on each project parameter at each iteration of the Monte Carlo simulation. It is performed using absolute units. For example, in the first iteration Risk A caused a delay of 2 days.
2. RiskyProject also calculates duration, cost, success rate, finish time, and work on each iteration.
3. RiskyProject calculates the Spearman RankOrder correlation coefficient between duration impact for each risk and project duration. This coefficient is presented in the Sensitivity view.
4. Correlation coefficients are not yet a risk impact. They only show how the risk affects the project. If a correlation coefficient is low, and the risk is not correlated with duration, it means than some other factors affect duration other than this risk. To become an impact, the correlation coefficient must be normalized. For example, you have a schedule, which has only one risk with an outcome of an increase in duration of 2 days. The correlation coefficient will be 100% because the schedule does not have any other uncertainties. Now change the risk outcome to 100 days. The correlation coefficient again will be 100%. Risk impact takes into account absolute value of duration increase, cost increase, etc. If the duration increases 2 times when compared with the original project schedule, the normalization coefficient is 1. Otherwise, the normalization coefficient will be greater or less than 1. Impact equals correlation coefficient multiplied with the normalization coefficient.
5. Risk probability is calculated based on the chance of risk for each assignment. If a risk has only one assignment, calculated probability equals input chance. If the risk has multiple assignments which are not mutually exclusive alternatives, the probability is calculated by combining risk results of each iteration as shown in the example:
Combined probability will equal 80%
6. Risk score equals probability multiplied by impact.
7. For risks affecting All Parameters (combination of duration, cost, safety, quality, etc.) calculated impact is calculated using impact for each risk category, multiplied on relative importance of risks for this category. For schedule related risk categories risk impact on finish time and success rate will not be used to calculate risk impact. For schedule related risk categories, the risk impact on finish time and success rate will not be used to calculate risk impact. This relative importance can be seen on the Categories and Outcomes dialog (Risk tab).
Intaver Support Team
Intaver Institute Inc.
Home of Project Risk Management and Project Risk Analysis software RiskyProject
www.intaver.com
Intaver Institute Inc.
Home of Project Risk Management and Project Risk Analysis software RiskyProject
www.intaver.com