Scatter Plot Percentile Setting
Moderator: Intaver Support
-
BusinessDecisions
- Posts: 12
- Joined: Tue Apr 03, 2007 11:25 am
- Location: USA
Scatter Plot Percentile Setting
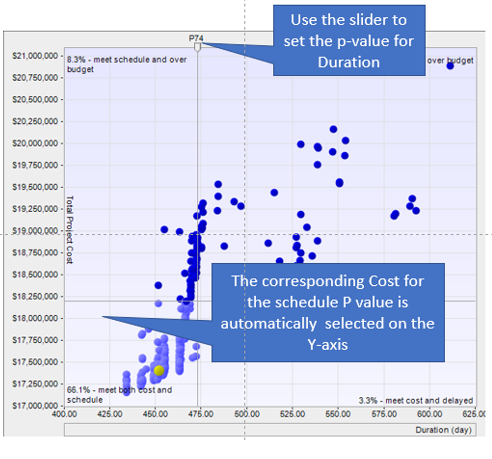
Is there a way to independently set cost and duration percentiles in the cost vs duration scatter plot (e.g. set cost at 90% and duration at 75%)? It appears both percentiles must be the same when selecting the percentiles line in the chart?
Decision Analysis, Risk Management, Construction Risk, Project Risk Management
-
Intaver Support
- Posts: 995
- Joined: Wed Nov 09, 2005 9:55 am
Re: Scatter Plot Percentile Setting
The Cost vs Duration Scatter Plot uses a slider to set the P-value for schedule (Cost or Finish Times) and the resulting chance of meeting Cost and Schedule at the selected percentile.
Intaver Support Team
Intaver Institute Inc.
Home of Project Risk Management and Project Risk Analysis software RiskyProject
www.intaver.com
Intaver Institute Inc.
Home of Project Risk Management and Project Risk Analysis software RiskyProject
www.intaver.com