Resource Overallocation Chart
Moderator: Intaver Support
Resource Overallocation Chart
What information does the resource allocation chart provide?
-
Intaver Support
- Posts: 995
- Joined: Wed Nov 09, 2005 9:55 am
Re: Resource Overallocation Chart
The resource allocation chart presents resource allocation information over period covered by the project.
You can select four different types of resource charts. Right-click on the chart and select a chart type from the shortcut menu.
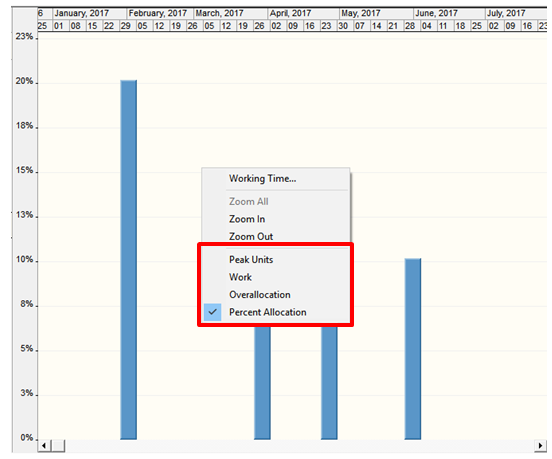
• Peak units: The highest level at which a resource is scheduled for all assigned tasks during a given period.
• Work: The total number of hours a resource is scheduled for all assigned tasks during a given period.
• Overallocation: A resource is over allocated when it has more work assigned than can be done in the resource's available time. Overallocation is number of hours a resource is scheduled for all assigned tasks over resource's available time. Overallocation can be presented only for work (not material) resources.
• Percent allocation: The percentage of a resource's capacity taken up by all of its assigned tasks during a given period. Percent allocation is only available for work (not material) resources.
Of these charts, we recommend the Overallocation view as this will identify periods during your project when you have more resource risks.
You can select four different types of resource charts. Right-click on the chart and select a chart type from the shortcut menu.
• Peak units: The highest level at which a resource is scheduled for all assigned tasks during a given period.
• Work: The total number of hours a resource is scheduled for all assigned tasks during a given period.
• Overallocation: A resource is over allocated when it has more work assigned than can be done in the resource's available time. Overallocation is number of hours a resource is scheduled for all assigned tasks over resource's available time. Overallocation can be presented only for work (not material) resources.
• Percent allocation: The percentage of a resource's capacity taken up by all of its assigned tasks during a given period. Percent allocation is only available for work (not material) resources.
Of these charts, we recommend the Overallocation view as this will identify periods during your project when you have more resource risks.
Intaver Support Team
Intaver Institute Inc.
Home of Project Risk Management and Project Risk Analysis software RiskyProject
www.intaver.com
Intaver Institute Inc.
Home of Project Risk Management and Project Risk Analysis software RiskyProject
www.intaver.com