Project Summary Charts: Show more details
Moderator: Intaver Support
Project Summary Charts: Show more details
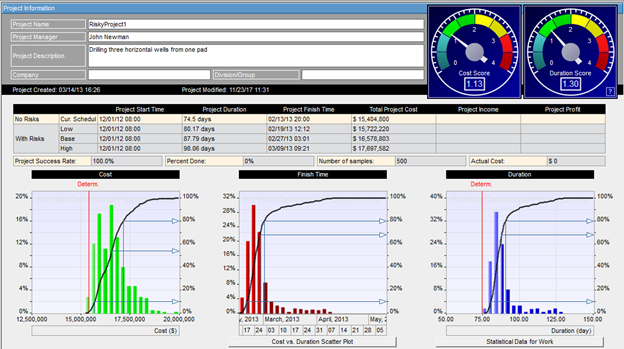
I like to use the Project Summary view in RiskyProject Enterprise as my main dashboard when reviewing the analysis. I have noticed that the markers that I have set up in the Options don’t appear on the charts in the main page. Is there a way to do this?
-
Intaver Support
- Posts: 995
- Joined: Wed Nov 09, 2005 9:55 am
Re: Project Summary Charts: Show more details
With version 7 in both RiskyProject Professional and RiskyProject Enterprise, we have added more chart options for appearance and labels. They can be added to both detail and small charts. To add the details to the small charts, setup your chart in the Chart Options dialog box and click the Draw these values on smaller charts check box.
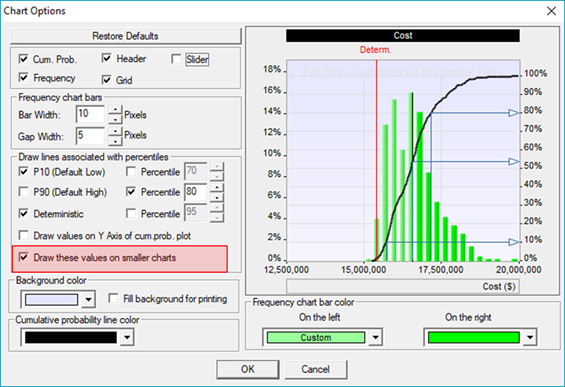
Click OK.
The values and indicators are displayed on the Project Summary charts.
Click OK.
The values and indicators are displayed on the Project Summary charts.
Intaver Support Team
Intaver Institute Inc.
Home of Project Risk Management and Project Risk Analysis software RiskyProject
www.intaver.com
Intaver Institute Inc.
Home of Project Risk Management and Project Risk Analysis software RiskyProject
www.intaver.com