Cumulative Probability Plot
Posted: Tue Jun 23, 2020 3:03 pm
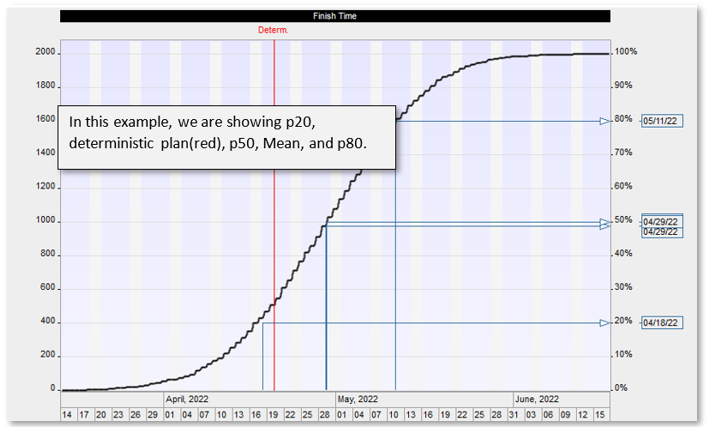
Can the software do a probability analysis for varying probabilities (i.e. P20, P50, P80 etc on the same program).
This forum includes discussions about project risk analysis software and project risk management software RiskyProject: theory, software features, best practices, possible problems, and user experience.
https://www.intaver.com/IntaverFrm/