Printing Histograms or Cumulative Probability Charts
Moderator: Intaver Support
Printing Histograms or Cumulative Probability Charts
How can I print the simulation result charts?
Business Development Manager
-
Intaver Support
- Posts: 995
- Joined: Wed Nov 09, 2005 9:55 am
Re: Printing Histograms or Cumulative Probability Charts
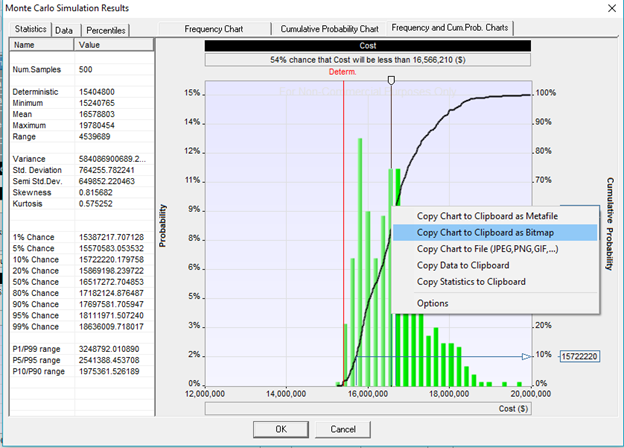
The quickest way to get a printed or hardcopy of the simulation results charts is to open the results that you want to print. This can be for activities on the Result Gantt or the project in the Project Summary. Once you have the charts open in RiskyProject, right-click and from the shortcut menu you can copy the chart image to the clipboard or as an image file.
You can use the image in presentation or document, which you can then print. Typically, people will copy the images into a standard report. It is also possible to print the charts using the Statistics Report.
You can use the image in presentation or document, which you can then print. Typically, people will copy the images into a standard report. It is also possible to print the charts using the Statistics Report.
Intaver Support Team
Intaver Institute Inc.
Home of Project Risk Management and Project Risk Analysis software RiskyProject
www.intaver.com
Intaver Institute Inc.
Home of Project Risk Management and Project Risk Analysis software RiskyProject
www.intaver.com