Professional version only
Project Summary View
The Project Summary view shows the main information about project:
total cost or revenue (if income is defined), finish time, duration,
and success rate for both deterministic and probabilistic
calculations.
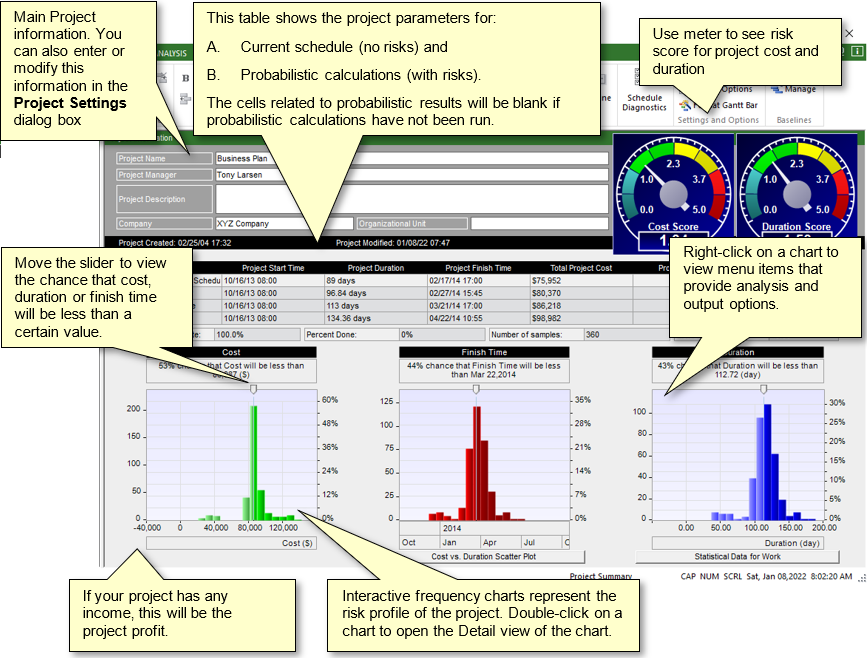
The Project Summary is divided into four sections:
- Main project information: the main project
information includes the project name, manager, etc.
- Main project parameters with and without risks: this table is located in the center of the project summary and
shows the project start time, duration, finish time, cost, income,
and revenue for the current schedule (no risks) and the low, base,
and high calculated results.
- Main project parameter frequency/cumulative
probability charts: interactive charts that show the
distribution of the results.
- Meters: provide project risk scores for cost and duration. You can adjust the scale and calculation formula for project meters by
clicking on the question mark (?) on the left bottom corner of the duration meter. You can also define a formula for project risk score.
See also
Task Simulation Results
Task Simulation Results Cost
Enlarge Task simulation results chart
Task Simuilation Results Options
|