Search Help:
Professional version onlyRisk Chart ViewThe Risk chart shows risks associated with tasks versus task duration or cost. The risk is expressed as:
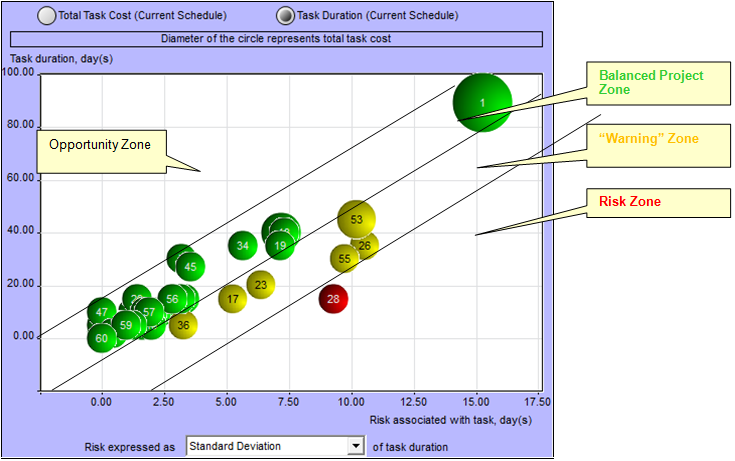
In well-balanced project schedules, different tasks usually have similar level of risks. However, if risk associated with a task is higher than for tasks with similar duration or cost, these risks should be carefully analyzed and possibly mitigated. Alternatively, if the task does not have significant risks and uncertainties compared with other similar tasks, it may represent an opportunity to increase the risks and increase benefits. 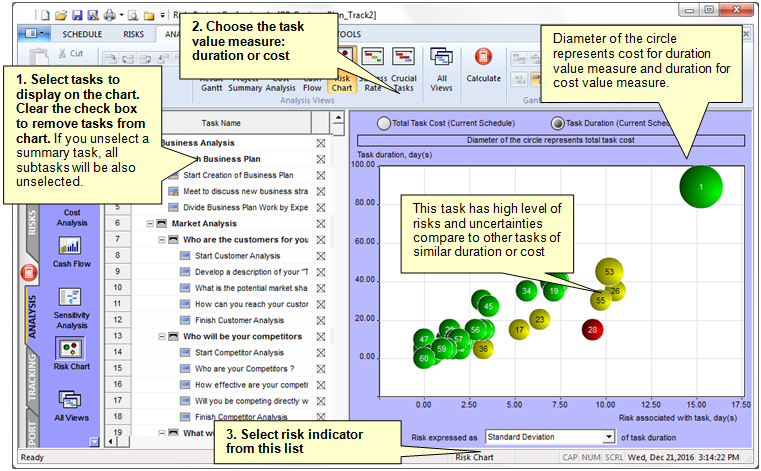
Analyzing the Risk Chart
The example below illustrates how the Risk Chart can be analyzed using "risk zones". If you visualize these zones on your risk chart, you can clearly see which tasks are outliers and merit further examination. Note: These zones are shown here purely for demonstration purposes and do not appear in the actual Risk Chart.
See also |