Search Help:
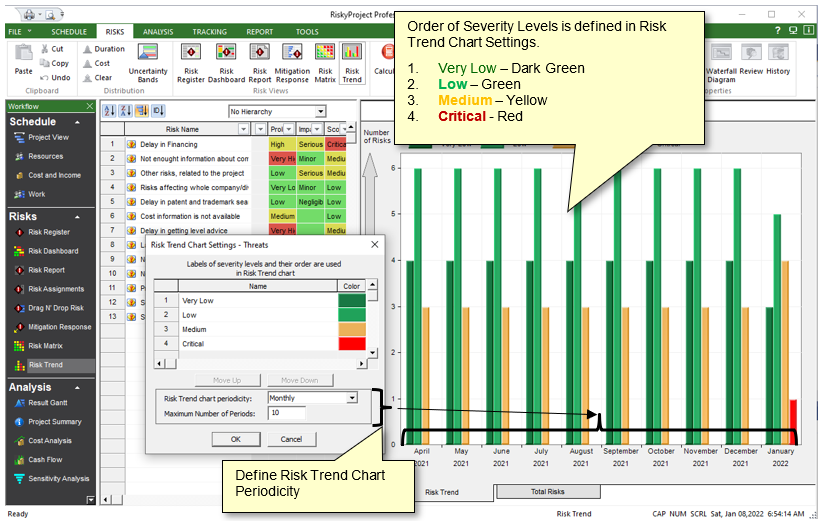
Risk Trend Chart SettingsRisk Severity LevelsEach color on risk matrix represents a particular risk severity level. By default, there are only three ranges: 'Low' – green, 'Medium' – yellow and 'Critical' - red. Each severity level can be associated with certain risk mitigation and response actions. For example, risks that appear on green cells are low risk and can be accepted. Using Risk Trend Chart settings dialog you can define:
Risk Trend chart settings can be invoked from Format Risk Matrix dialog or by right click on Risk Trend Chart. See also |