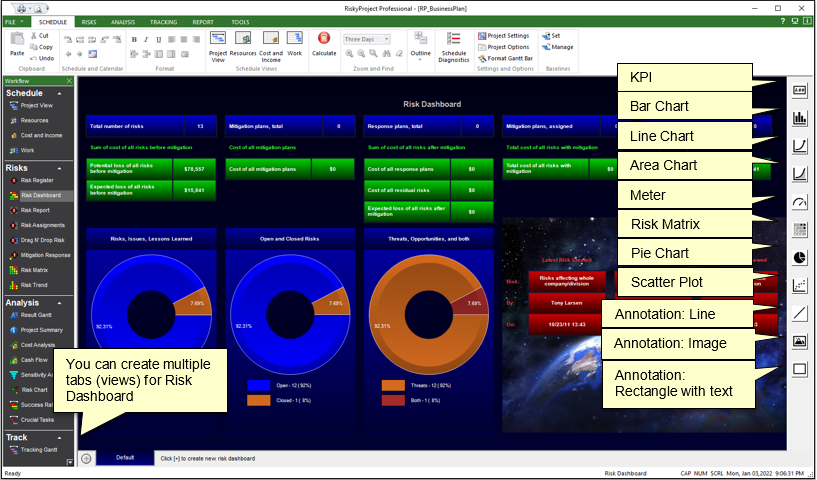
Risk Dashboard
The fully customizable Risk Dashboard allows you to present hundreds of different KPIs and charts related
to your risks. You can create any number of dashboards with different information, which are shown as different
tabs within Risk Dashboard View. You can select from 7 types of charts: line, area, pie, scatter, bar
(including frequency histogram), different types of meters, and risk matrixes. You can place them in
different areas on the dashboard, adjust their size, colors, and other properties. You can also annotate your
dashboard with text, lines, and images.
When you modify your risk data, the charts and KPIs are automatically updated. This date includes risk properties,
mitigation and response plans, and project schedules. Annotation is not updated when we update risk data.

To add a chart, KPI, or annotation to the Risk Dashboard:
- Select the type of chart or KPI from the toolbar on the right side.
- Click on the dashboard and drag the line or rectangle to select the position of the chart, KPI, or Properties annotation.
- Right click on chart, KPI, or annotation.
- Select Properties from shortcut menu; Properties dialog opens.
- Enter properties of the chart, KPI, or annotation; it includes type of chart or what type of data this chart, KPI or annotation will represent as well as graphic properties.
- Click Close to close the Properties dialog box.
To modify a chart, KPI, or annotation:
-
Click on the chart, KPI, or annotation; chart, KPI, or annotation you want to modify.
-
Move or expand the area to adjust size or position of the chart, KPI, or annotation
-
Right click on chart, KPI, or annotation and click Properties from shortcut menu; Properties dialog opens.
-
Modify properties of the chart, KPI, or annotation; it includes type of chart or what type of data this chart, KPI or annotation will represent as well as graphic properties.
-
Click Close to close the Properties dialog box.
-
To enter text or update font and alignment, right click on KPI and Annotation rectangle and select Edit or Format Text within a shortcut menu.
To export dashboard:
-
Right click in any place of dashboard, and from the shortcut menu click Copy Dashboard to Clipboard or Copy Dashboard to File.
-
In you export dashboard to file, you can select file format: JPEG, PNG, GIF, BMP, or TIFF
Notes
-
Many KPIs and charts are based on results of Monte Carlo simulations. Therefore you need to perform calculation to see results of analysis on the dashboard.
-
RiskyProject comes with default dashboard. To Generate default dashboard right click in any place of dashboard and select Create Standard Dashboard from shortcut menu.
-
To completely clear dashboard click in any place and select Clear Dashboard from shortcut menu.
-
You can save dashboard in system registry for all new project. To do then click in any place and select Save Dashboard as Default from shortcut menu.
-
You can modify background color of dashboard by clicking in any place and selecting Dashboard Setting from shortcut menu
-
You can copy and paste selected chart, KPI, or annotation. To do that right click on any selected chart, KPI or annonation, and select Copy from shortcut menu. Then right click on any area of dashboard where you want to paste it and select Paste from shortcut menu.
- Risk Dashboard can be printed. To Print dashnoard click on File > Print
See also
Reports
Project Dashboard
|

