Professional version only
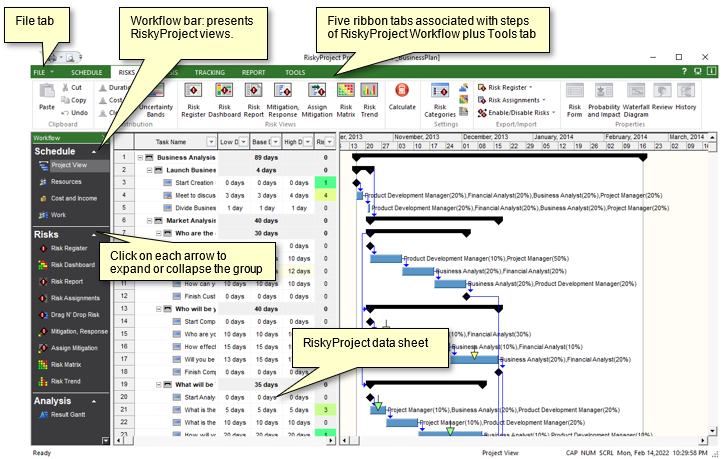
RiskyProject Interface
RiskyProject workflow includes five steps:
- Schedule: Enter or import Schedule, Resources, Cost and Income, and Work
-
Risks: includes a Risk Register and Risk Dashboard, Assign risks to tasks and resources, Mitigation/Response plan depository; Risk Matrix and Risk Trend charts
-
Analysis: includes a Risk-Adjusted Schedule, Summary of risk analysis results, Cost and Cash flow analysis results, Risk Chart, Success rate and Crucial Tasks
-
Tracking: includes a Tracking Gantt Chart and linear Tracking Chart
- Reporting: includes various hard-coded and customizable Risk Reports
Each step has multiple views which are used to enter data or to present the result of analysis. The views are shown in two places: in the ribbon the top and in the workflow bar on the left.
You can open and close multiple project schedules during one session in RiskyProject. You can open and close multiple project schedules during one session in RiskyProject.
Customizing Workflow Bar
You may enable and disable views from the Workflow bar. By default some views, including Assign Mitigation and Risk Status are disabled.
To Customize Workflow Bar:
-
Right click on Workflow bar.
- In Enable/Disable Views from Workflow Bar dialog select views phases you wish to Enable or Disable.
You can also right click on Workflow bar to be presented with the same dialog.
Application Look
You can modify the color and style of title bars, toolbars, and status bars, as well as the theme for the datasheets.
The theme is used for all grid views including those inside dialog boxes. Before changing the application look, close all
active projects. After you have modified the application look, you must restart RiskyProject to enable the changes.
Changing the application look
On the Tools tab, in the
Resources
and Settings
group, click Application
Look.
See also
Reports
|