Professional version only
Simulation Result Detail Chart
The Detail Simulation results chart is a convenient way to present textual and graphic information within one dialog box. Text information is displayed in three tabs:
- Statistics - displays the distribution's statistical parameters (mean, standard deviation, etc). See the glossary for full description of statistical parameters.
- Data - displays all data samples (calculated cost, duration, start and finish times on each iteration)
- Percentiles - displays every fifth percentile.
The Detail chart has the same features to copy chart and data to the clipboard and as a JPEG file as the regular chart.
To view detailed task simulation results:
- Click the tabs on the top of the charts to toggle
between Frequency, Cumulative
Probability views, or their combination.
- Click the Statistics, Data,
or Percentiles to view more detailed views of the
result data.
- * If you created at least one baseline with results of analysis, you will see detailed chart with multiple cumulative probability plots.
A list of baselines is shown in the left bottom corner of the dialog box. You can enable and disable plots, as well as change colors
for the plots. By using multiple cumulative probability plots, you can compare uncertainties in different project scenarios for particular
task or for whole project.
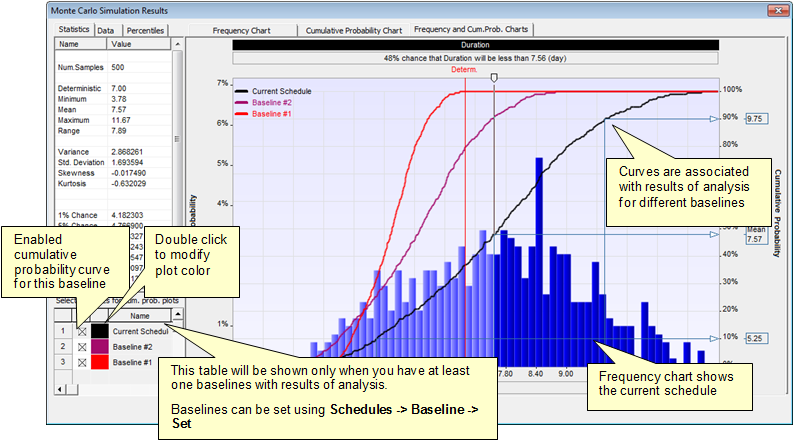
* Ability to present multiple cumulative probability plots on the same chart was introduced in RiskyProject version 7.1
Notes
- Right-click on a chart to copy the chart, statistics or data
to the clipboard or view cumulative probability, frequency charts,
or their combination.
- You may format charts using Options button for short cut
menu.
See
also
About
task simulation result chart
Simulation
Result Options
|