Customizing the Statistics Report
You can modify the statistics report by adding or removing histograms,
statistics, or the sensitivity chart as well as the general project information
that is included.
To customize the statistics report:
- Click the Reports tab. In the Report Views
group, click Statistics Report.
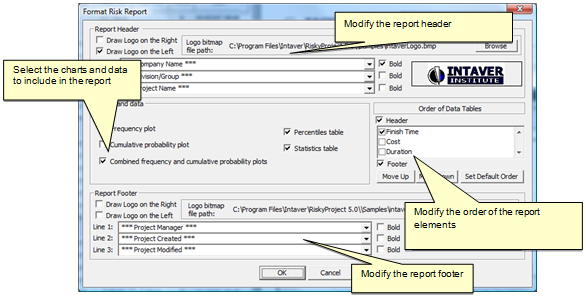
- Click the Customize Report button. The Format Risk
Report dialog box opens.
- In the Charts and Data group, add or remove the charts and
tables that you want to include in the report.
- Modify the order in which the report elements are presented in the Order
of Data tables.
- Add or modify Header and Footer information.
See also
RiskyProject Reports
Statistics Report for Quantitative Analysis
Project Dashboard
Task Reports
Risk Reports
|