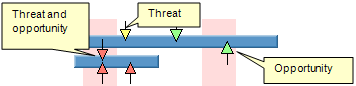
Search Help:

Risk Assignments on the Gantt Chart

Risks and issues can be shown on the Gantt chart as arrows:

Project risk management: Threats and Opportunities

Colors represent the calculated the impact of the risk on all project parameters combined. The size of the arrow represents probability. You may click on each risk arrow within a Gantt chart to be presented with information about risks.


  • Only local risks are shown as arrows.
  • You cannot add or remove mutually exclusive alternatives using this dialog, but you can chance of occurrence, outcomes, result, and moment of risk.

Showing or hiding risks on the Gantt chart

Click the Project risk management: show risks on Gantt Chart button with a standard toolbar to toggle the risk arrows on or off.

See also

Risks in RiskyProject
Assigning local and global risks

Legal Notice Privacy Statement Copyright © Intaver Institute Inc., 2002-. All Rights Reserved.