Search Help:
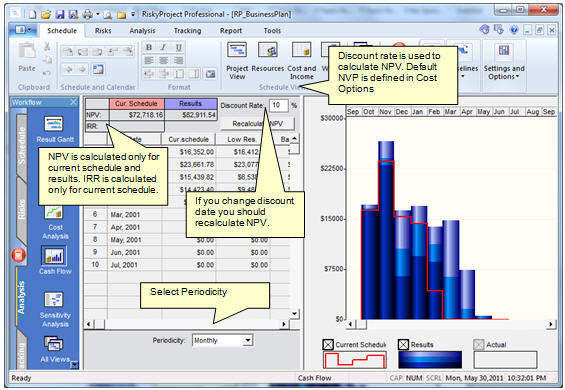
Cash Flow ViewYou can view a project cash flow. The Cash flow analysis view shows monthly, bi-monthly, quarterly, and yearly cost and income allocation. You can also apply Net Present Value (NPV) discount rates and internal rate of return (IRR). The Cash flow view includes cost and income data in both table and chart format for the current schedule, results of analysis, and actuals. The Cash Flow view shows a comparison between Current Schedule, Calculated (with risks and uncertainties), and Actual project cost and income.
|