

Merge Bias in Project Scheduling
Example of project schedule with parallel activities
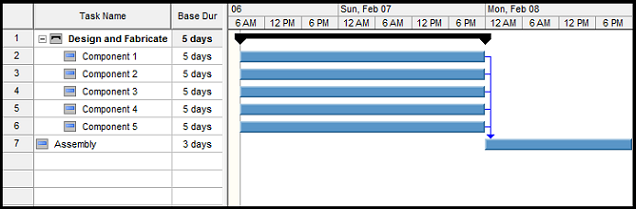
Traditional schedule analysis using Critical Path Method (CPM) can provide overly optimistic estimates and one of the primary reasons is the impact of parallel activities and merge bias when you have activities with uncertain durations.
It is extremely common to find parallel activities in project schedule. Parallel activities occur where two or more activities must be completed before a subsequent activity can start. The end results of these activities “merge” into a common activity, thus the reference to merge bias. An example might be where a company is developing a system that includes the assembly of multiple components. The assembly work cannot begin until the design and fabrication of all the components have bed completed. In CPM, the component that takes the longest determines when the successor task can begin and is considered to be on the “critical path”.
Uncertainties in project schedule with parallel activities
However, these are only estimates for the activities and in most cases, they are what the planners have indicated are the most likely duration for these activities. In other words, while these activities most likely will take an estimated time, the reality is that they could take less or more time the most likely estimate, this is because all activities are inherently probabilistic and possess an inherent uncertainty and may be impacted by risks that occur during the execution of the activity.
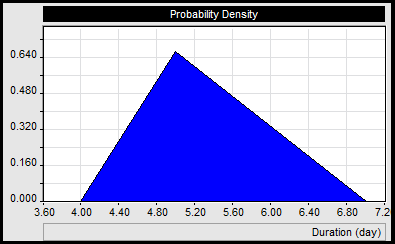
If we look at the single activity Component 1, a more realistic probabilistic estimate would include a low and high estimate to account for the uncertainties and risks. In this case we will assume that best case is 4 days and the worst case is 7 days and that there is less probability that that a certain duration will occur the farther it is from the most likely estimate of 5 days. We can model probability distribution using a simple triangular distribution. Visually it would appear like this:
Impact of Merge Bias
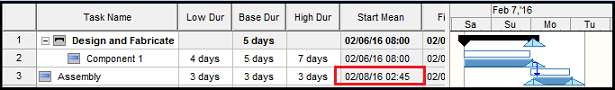
Let's assume that you have only one component. In the figure below, the white bars show the original estimate and the blue bars show the mean results. You can see that Task assembly will start on 02/08/16 2:45.
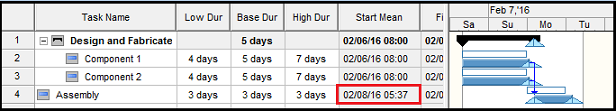
Here is the example with two components. The average start time for the Assembly tasks is now on 02/08/16 5:37. The addition of another similar Component activity has delayed the average start time by about 8%
Finally here is the example with five components. Average start time for the task Assembly is now 02/08/16 8:53 a delay of about 16% as compared to the original estimate. You can clearly see the gap between start time of activity "Assembly" and finish times of all activities "Component ...".
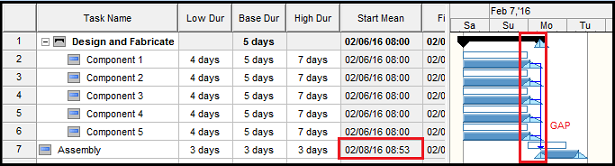
This effect occurred because duration of fabrication of individual components is not completed at the same time. These durations are not correlated. For example, fabrication of Component 1 may take longer, but at the same time fabrication of Component 2 may take shorter period if time. Start time of "Assembly" is calculated based on longer duration of activities "Component ...".
If we apply this onto current projects who are characterized by increasing complexity and size with many merge points, the potential impact of the merge bias and parallel activities can significantly affect your ability to meet key milestones and delivery dates. Monte Carlo simulation allows you to account for the impacts of merge bias and ensures that you have a credible project schedule.


