Page 1 of 1
Mean vs P50 in schedule risk analysis
Posted: Sun Oct 25, 2015 12:41 pm
by Daniel001
We have been asked to rebaseline our project based on the P50 results of the analysis. This has been taken by some of our project team members to indicate the Mean or average of the results. I think I remember reading that this is not the case in schedules because of the shape of the histogram.
Re: Mean vs P50 in schedule risk analysis
Posted: Sun Oct 25, 2015 12:44 pm
by Intaver Support
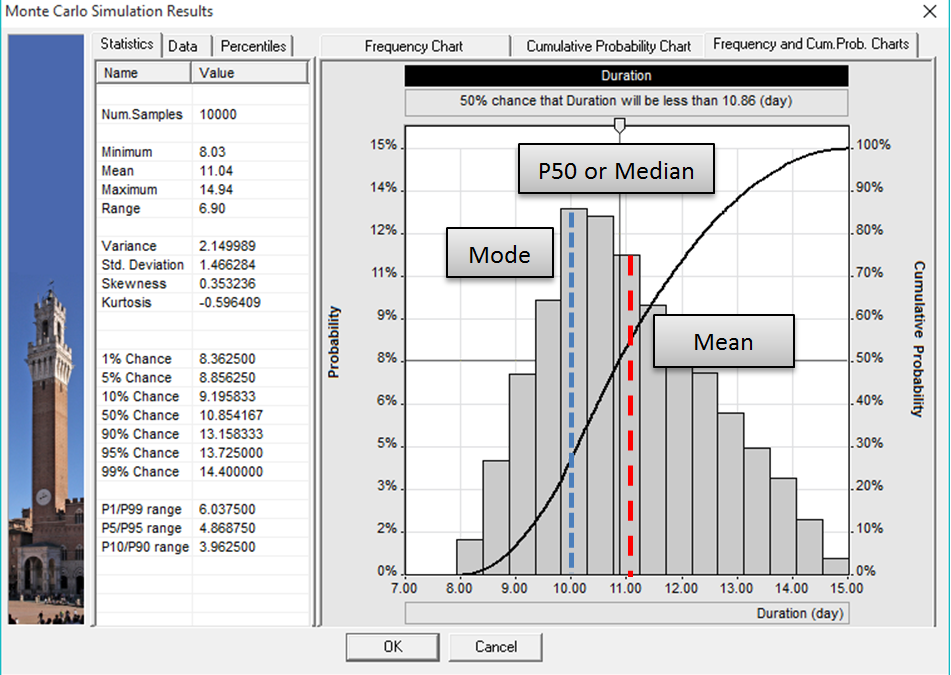
It is a common misunderstanding that the P50 is a synonym for the Mean or Average. If the probability distribution for activities were symmetrical, this this would be the case, where the Mode, Mean and P50 all would be the same. It might be better to provide the alternative name to P50 which is the Median.
In the case of schedules, the distribution almost always tend to be right skewed as there is a finite amount that it can shorten, but an infinite amount that it could extend (possibly never be finished). Because of this right skewedness, the Mode (most likely), P50, and the Mean begin to diverge.
Lets take a look at the below graph. If we look at the left, we can see that the Mean is ~ 11 days, and the P50 is 10.8. The most likely is even farther to the left somewhere around 10 days.
Therefore, generally the Mean is a slightly higher level of confidence (finish at or before) than the P50. In the case below, the Mean represents about P55.