Page 1 of 1
Risk arrows on the Gantt Chart
Posted: Wed Dec 09, 2015 4:09 pm
by MTC465
We have found that showing the location of the risks on the Gantt chart is very useful during our project reviews. Are you considering anyway show details of the risk without having to leave the Gantt chart. We think that this type of interaction would be very useful.
Re: Risk arrows on the Gantt Chart
Posted: Wed Dec 09, 2015 4:11 pm
by Intaver Support
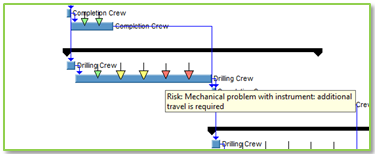
The risk arrows on the Gantt bars lets the team know where the risks are assigned to the schedule and their criticality (green, yellow, or red). Each of the risk indicators (arrows) on the Gantt bars represents not just a risk assignment, but the risk assignment to a particular risk category( Cost, Schedule or other category). As you noted if you hover over the risk indicator, a pop up bubble opens up with the risk name as below:
If you double-click on the risk indicator, it will display the Local Risk Assignment information. In addition this information is editable, so you can use this feature to modify risk assignment (chance or outcome) if required from the Gantt chart.