Page 1 of 1
How do can I highlight bars in the Result Gant
Posted: Thu Oct 29, 2015 2:09 pm
by Fred45
I would like to use a similar color coding that you have in other views to highlight the low, base, and high. For example, have the low results bar as green, the base as Yellow and, High Results red.
Re: How do can I highlight bars in the Result Gant
Posted: Thu Oct 29, 2015 2:11 pm
by Intaver Support
I think that is a very interesting method to highlight the different results. One thing to note is that in other views we use the green, yellow and red to indicate levels of risks. In the result Gantt the low or high results are not indicative of low or high risk, but low or high certainties of meeting specific dates. For example, if you ran a monte carlo schedule risk analysis on a 5 day task with low and high durations of 4.5 and 5.5 days, there would be very little variance and the green, yellow, red type coloring could be misleading if it was interpreted as low and high risk.
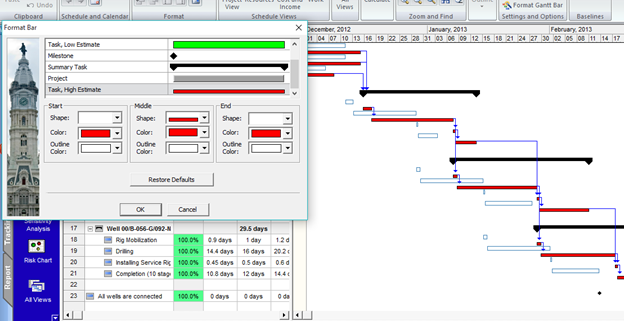
If you do want to try this, you can modify the Gantt bars in any of the views using the Schedule >Settings and Options > Format Gantt Bar. You can choose shapes, colors and outlines for any of the Gantt Chart bars including the Low and High results.
In the example below, the high results have been modified to show as red. Please note, you can not show the Low and High results as indivual bars at the same time.