Page 1 of 1
Printing Gantt Chart for Schedule Risk Analysis
Posted: Fri Oct 02, 2015 10:19 am
by RiskAnalyst
We would like to provide a printed out version of the Gantt charts, especially the Risk Adjusted Gantt chart, that shows the original and results from our Monte Carlo schedule risk analysis.
Re: Printing Gantt Chart for Schedule Risk Analysis
Posted: Fri Oct 02, 2015 10:26 am
by Intaver Support
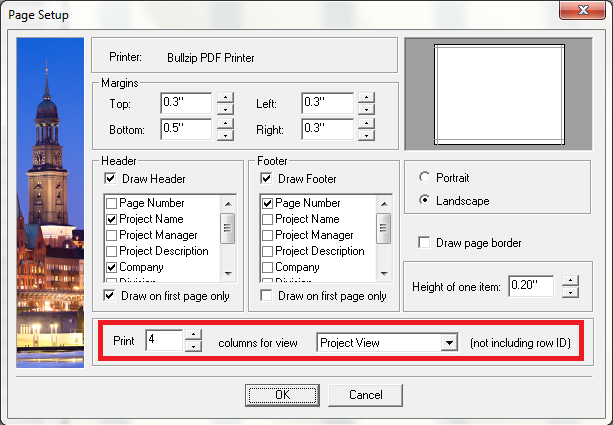
The printing feature is controlled using the Page Setup menu that can be found in the File>Print menu options. The Print Preview dialog allows you to setup how ad-hoc reports (reports generated directly from the screen view) appear. You may need to indicate how many data columns that you would like to see. This is not dependent upon the current number of columns that are shown in the View. For example if you have 4 columns visible in the view, but enter 1 in the Print x Columns for view <View name>, only the first column from left to right will be included in the print out. It can be done not only for risk adjusted Gantt chart (results of schedule risk analysis), but also for any other views.