Search Help:


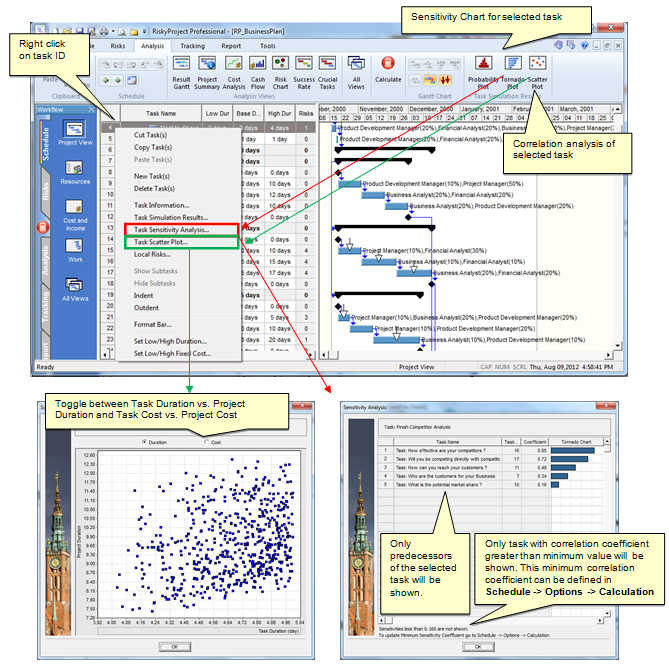
Viewing sensitivity analysis for each task

Sensitivity analysis is available for each activity. Two types of charts are available:

  1. Tornado Plot: the chart will show how finish time of task predecessors will affect finish time of the selected tasks.
  2.  Scatter Plot: the chart will show correlation between task duration or cost and project duration or cost.

To view the sensitivity analysis for a single activity:

  1. Run a Monte Carlo simulation.
  2. Click on the task from which to generate a sensitivity analysis.
  3. Click the Analysis tab. On the Task Simulation Results group, click Tornado Plot or Scatter Plot. A tornado chart or scatter plot opens. You may also right click on task ID and then click on Task Sensitivity Analysis or Task Scatter Plot.

See also

Sensitivity Analysis

Legal Notice Privacy Statement Copyright © Intaver Institute Inc., 2002-. All Rights Reserved.