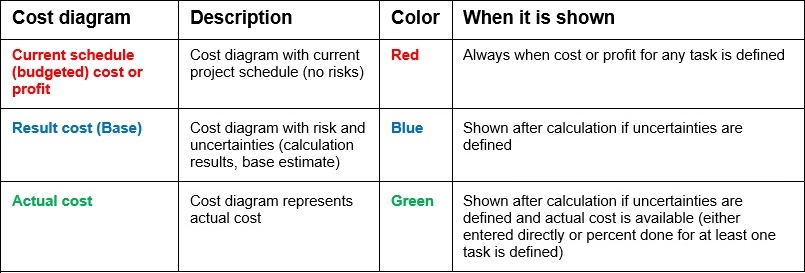
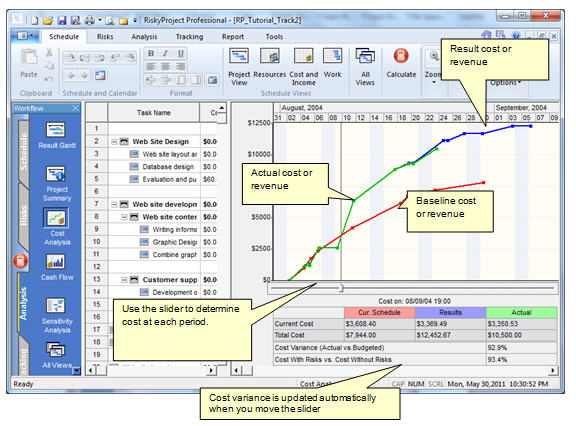
Search Help:

Analyzing Cost and Revenue

Use the Cost Analysis view to analyze cost and revenue on each stage of the project. The Cost Analysis view has up to three cost diagrams:

Risk Analysis: Cost and revenue chart

You may use the slider to determine:

  • Cost Variance (actual vs. budgeted cost)
  • Cost with Risks and uncertainties vs. Current schedule (budgeted) cost.

Risk Analysis: Analyzing cost and revenue


  • If income is defined for at least one task, the cost analysis diagram will show the project revenue calculated based on the formula: Revenue = Income - Cost.
  • If Cost exceeds Income in any given period of time Revenue will be negative.
  • If income is not defined, Cost will be always positive.

Use the shortcut menu to manipulate with chart. In particular, instead of presenting a line chart of current schedule, result, and actual cost, you can present an area chart by choosing Fill Chart from the shortcut menu.


See also

Adding Fixed Costs and Income to tasks
Cash Flow Analysis

Legal Notice Privacy Statement Copyright © Intaver Institute Inc., 2002-. All Rights Reserved.