Search Help:
Professional version onlyCrucial Tasks ChartIn addition to sensitivity charts, the results of sensitivity analysis can be presented on the Crucial tasks Gantt chart. Each task can belong to one of three categories: 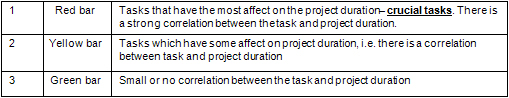
To explain crucial tasks, we use the "spring analogy". Let us assume that each task is a spring in a big system of springs. When we start moving springs back and forth, we find that some of them significantly affect the movement of the full spring system, while others do not. The amount of movement depends on how springs are connected to each other (links between tasks) and how flexible they are (the type of risks and uncertainties they have assigned).
Crucial tasks may not lie on the critical path; however, in many cases, crucial tasks will lie close to the critical path because they are defined by the project schedule structure and risk and uncertainties associated with each task. Critical path calculations take into account only the project schedule structure. Viewing the Crucial Task chartBy default, the Crucial Tasks View is not shown on the Analysis Workflow bar. The Crucial Tasks view provides another analysis view to investigate the root causes of project uncertainties.
See also |
