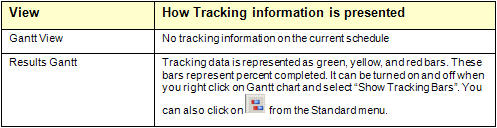
Tracking Results
The probabilistic calculations always encapsulate the tracking
information if it has been entered for a task. RiskyProject shows
results of the tracking calculations in several different ways
depending upon the view you are using to examine it.
Entering tracking data
- Select the task to which you want to enter the tracking data.
- Open the Task Information dialog box.
- Click the Tracking tab. By default, the first row should
contain the actual start time with zero percent done.
- Click the row below the previous entry.
- Enter the status date or select it from the calendar.
- Enter the percentage of the task completed by the specified date. All
dates and percentages must be consistent. For example, you cannot have a record
with 60% completed before a record with 40% completed. In addition, you cannot
have historical data with the date Jan 5,2004 before the record with Dec
14,2003.
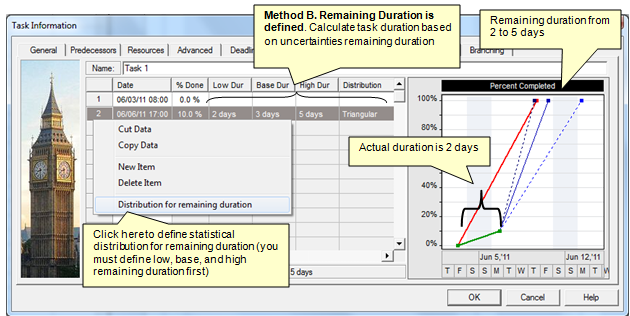
- Optionally enter remaining duration parameters: low, base, and high
duration, and statistical distribution for remaining duration. If you don’t
enter this information remaining duration on each iteration will be calculated
using extrapolation of original duration.
- Define parameters of statistical distribution for remaining duration (see
Defining statistical distribution for remaining duration for more information).
- Type in a comment to record actual details of work completed. You can now
view the Tracking chart.
- To view any tracking information, including the percentage completed for summary
tasks and the project, you must calculate the project.
- Remaining duration information is used only for probabilistic analysis.
See
also
Tracking Performance
Task Information Tracking
|